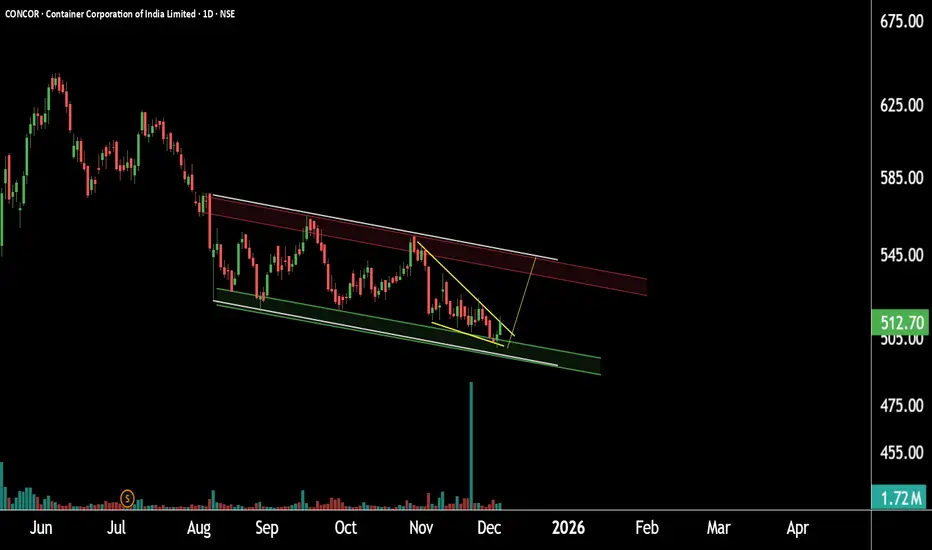
This is the daily timeframe chart of Concor.
The stock is trading within a falling channel pattern, with a strong support zone around 490–510.
On the shorter timeframe, the structure is forming a falling wedge near the 500–510 area. If this support zone holds,
the stock may witness a potential upside toward 540.
Thank you.
The stock is trading within a falling channel pattern, with a strong support zone around 490–510.
On the shorter timeframe, the structure is forming a falling wedge near the 500–510 area. If this support zone holds,
the stock may witness a potential upside toward 540.
Thank you.
@RahulSaraoge
Connect us at t.me/stridesadvisory
Connect us at t.me/stridesadvisory
כתב ויתור
המידע והפרסומים אינם מיועדים להיות, ואינם מהווים, ייעוץ או המלצה פיננסית, השקעתית, מסחרית או מכל סוג אחר המסופקת או מאושרת על ידי TradingView. קרא עוד ב־תנאי השימוש.
@RahulSaraoge
Connect us at t.me/stridesadvisory
Connect us at t.me/stridesadvisory
כתב ויתור
המידע והפרסומים אינם מיועדים להיות, ואינם מהווים, ייעוץ או המלצה פיננסית, השקעתית, מסחרית או מכל סוג אחר המסופקת או מאושרת על ידי TradingView. קרא עוד ב־תנאי השימוש.