📉 🔴
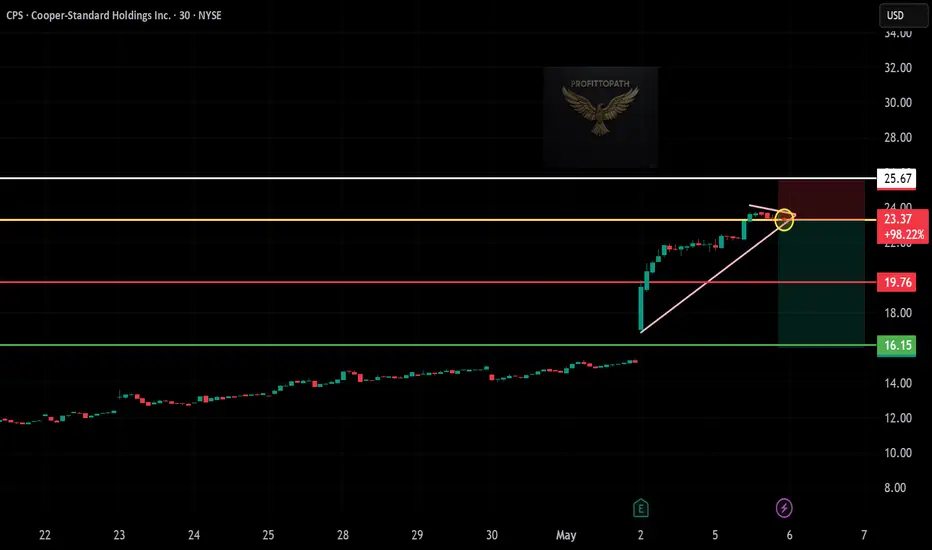
Ticker: CPS (Cooper-Standard Holdings Inc., NYSE: CPS)
Chart: 30-Minute Timeframe
Pattern: Rising wedge breakdown + trendline rejection
🔻 Entry: $23.37 (break below wedge + resistance rejection)
🔻 Stop-Loss: $25.67 (above wedge breakdown and structure)
🔻 Take Profits:
• TP1: $19.76 – First support zone
• TP2: $16.15 – Measured wedge breakdown target
⚖️ Risk-Reward:
• Risk/Share: $2.30
• Reward to TP2: $7.22
• R:R Ratio: ~1:3.1 ✅
🧠 Technical Highlights:
– Rising wedge pattern broken to downside
– Strong rejection at key resistance (yellow zone)
– Bearish confirmation after breakdown with retest
כתב ויתור
המידע והפרסומים אינם מיועדים להיות, ואינם מהווים, ייעוץ או המלצה פיננסית, השקעתית, מסחרית או מכל סוג אחר המסופקת או מאושרת על ידי TradingView. קרא עוד ב־תנאי השימוש.
כתב ויתור
המידע והפרסומים אינם מיועדים להיות, ואינם מהווים, ייעוץ או המלצה פיננסית, השקעתית, מסחרית או מכל סוג אחר המסופקת או מאושרת על ידי TradingView. קרא עוד ב־תנאי השימוש.