✅ Key data & current state
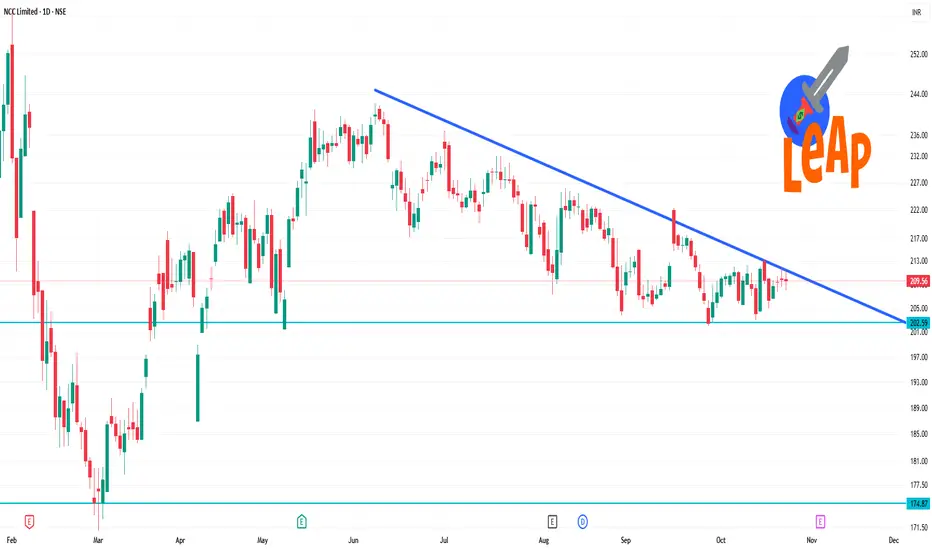
The stock is trading around ~₹ 206-₹ 209 as quoted recently.
On the daily chart:
14-day RSI is ~54 (neutral zone) according to one source.
Moving averages: 5-day MA ~208.19, 50-day ~208.28 (both slightly above current price) → bullish sign short term.
200-day MA ~209.77 is slightly above current price, meaning price is just below a longer-term average.
Technical indicators show mixed signals: some “buy” signals from moving averages, but overall “neutral” from aggregate indicators.
פרסומים קשורים
כתב ויתור
המידע והפרסומים אינם אמורים להיות, ואינם מהווים, עצות פיננסיות, השקעות, מסחר או סוגים אחרים של עצות או המלצות שסופקו או מאושרים על ידי TradingView. קרא עוד בתנאים וההגבלות.
פרסומים קשורים
כתב ויתור
המידע והפרסומים אינם אמורים להיות, ואינם מהווים, עצות פיננסיות, השקעות, מסחר או סוגים אחרים של עצות או המלצות שסופקו או מאושרים על ידי TradingView. קרא עוד בתנאים וההגבלות.