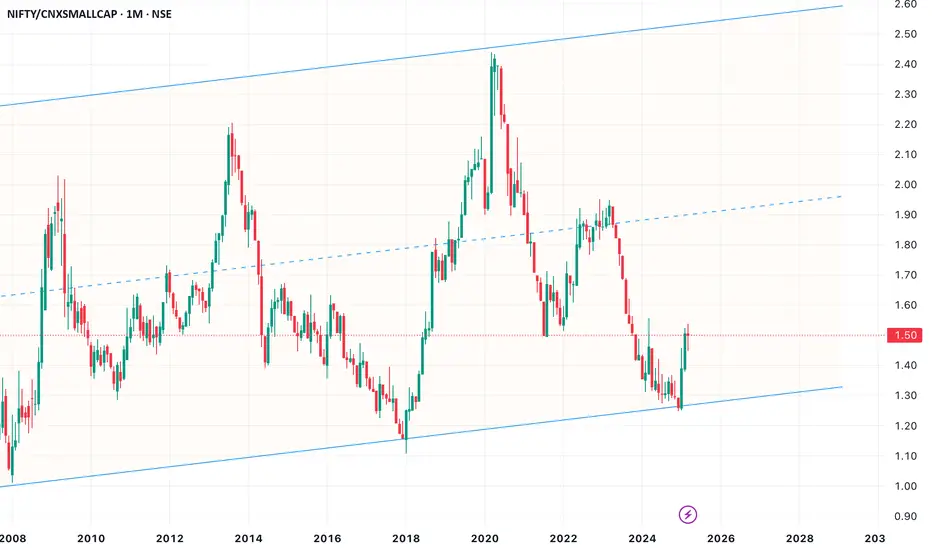
This ratio chart between LargeCaps and SmallCaps has been a good retail sentiment indicator. At the extremes, it has been a good contrarian indicator
When large-cap underperformance reaches an extreme low and starts to reverse, like in 2024 Sep, one of the 3 scenarios unfolds and seems to last 18 to 24 months
1. Both LargeCaps and SmallCaps correct, but SmallCaps correct even more
2. LargeCaps are relatively stable but SmallCaps are correcting
3. LargeCaps are rallying and SmallCaps are yet to catch up
Let's see if Scenario 1 >>> Scenario 2
Ps: This is NOT an investment advice
כתב ויתור
המידע והפרסומים אינם מיועדים להיות, ואינם מהווים, ייעוץ או המלצה פיננסית, השקעתית, מסחרית או מכל סוג אחר המסופקת או מאושרת על ידי TradingView. קרא עוד ב־תנאי השימוש.
כתב ויתור
המידע והפרסומים אינם מיועדים להיות, ואינם מהווים, ייעוץ או המלצה פיננסית, השקעתית, מסחרית או מכל סוג אחר המסופקת או מאושרת על ידי TradingView. קרא עוד ב־תנאי השימוש.