XLM has been one of the top movers, sweeping the January 2025 swing high at $0.515 before stalling and moving sideways for the past 4 days.
Is XLM gearing up for another push toward the highs, or is a correction imminent?
Let’s dive into the details.
🧩 Market Structure & Fractal Pattern
XLM skyrocketed +132% in just 13 days, mirroring the explosive move seen back in November 2024.

If we apply the November fractal, the current price action suggests we could be setting up for an ABC corrective move.

📉 Key Levels & Confluences
➡️ Conclusion: The $0.4142–$0.4056 zone is a critical support and liquidity area with multiple confluences lining up.
Trade Setups
🔴 Short Setup:
🟢 Long Setup:
⚡ Final Thoughts
Watch for a potential final push toward $0.49–$0.50 before a corrective wave unfolds.
The confluence at the $0.4142–$0.4056 zone — including monthly/weekly levels, VWAP, liquidity pool, and the 1.0 TBFE target — makes it a key area for decision-making.
Stay patient and wait for confirmation at these levels. Will post an update as things unfold!
_________________________________
💬 If you found this helpful, drop a like and comment!
Want breakdowns of other charts? Leave your requests below.
Is XLM gearing up for another push toward the highs, or is a correction imminent?
Let’s dive into the details.
🧩 Market Structure & Fractal Pattern
XLM skyrocketed +132% in just 13 days, mirroring the explosive move seen back in November 2024.
If we apply the November fractal, the current price action suggests we could be setting up for an ABC corrective move.
📉 Key Levels & Confluences
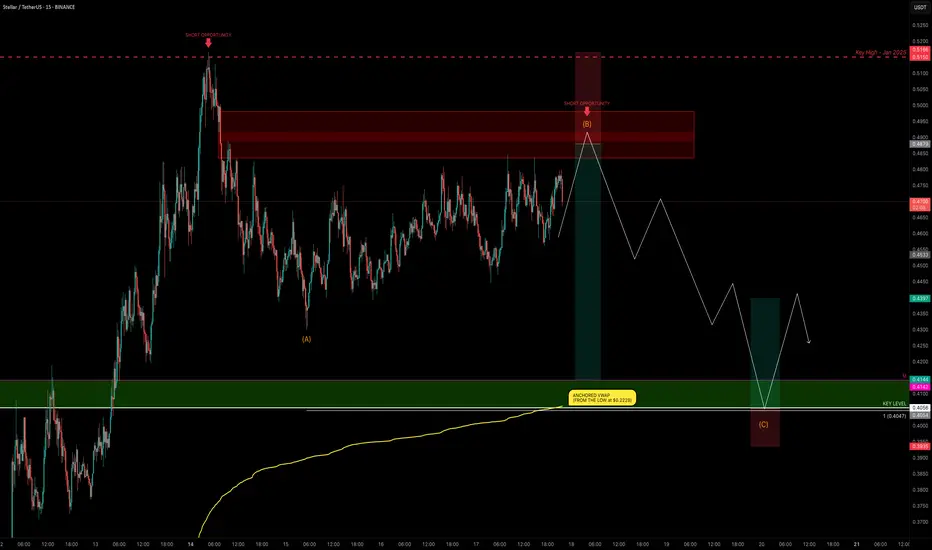
- FVG Zone: ~$0.49–$0.50 — likely to be swept before any major move down.
- Monthly Support: $0.4142
- Key Level / Liquidity Pool: $0.4056 — likely cluster of stop-losses.
- Anchored VWAP (from $0.2228 start of trend): currently near $0.4056, adding strong confluence.
- 1.0 Trend-Based Fib Extension (ABC projection): If price pushes to ~$0.49 to complete wave B, the projected 1.0 TBFE for wave C lands right on the $0.4056 key level + VWAP, creating a perfect confluence zone.
➡️ Conclusion: The $0.4142–$0.4056 zone is a critical support and liquidity area with multiple confluences lining up.
Trade Setups
🔴 Short Setup:
- Entry zone: $0.48–$0.50 (ladder in)
- Stop-loss: Above $0.5166 (prior high)
- Take-profit: $0.4142–$0.4056 zone
- R:R ≈ 1:3
🟢 Long Setup:
- Entry zone: $0.4142–$0.4056 (preferably near VWAP)
- Stop-loss: Below $0.395
- Take-profit: $0.44
⚡ Final Thoughts
Watch for a potential final push toward $0.49–$0.50 before a corrective wave unfolds.
The confluence at the $0.4142–$0.4056 zone — including monthly/weekly levels, VWAP, liquidity pool, and the 1.0 TBFE target — makes it a key area for decision-making.
Stay patient and wait for confirmation at these levels. Will post an update as things unfold!
_________________________________
💬 If you found this helpful, drop a like and comment!
Want breakdowns of other charts? Leave your requests below.
הערה
🚨 XLM UpdateXLM just took out the highs again with an SFP (swing failure pattern), a classic liquidity grab.
Now I’d like to see a correction down toward the $0.43 lows to sweep liquidity.
Key levels to watch:
➡️ $0.47 → important reaction zone (weekly open + POC of the trading range)
➡️ $0.43 → liquidity target below
➡️ dOpen → acting as current S/R flip
הערה
Next Trading Idea:הערה
🚨 XLM UpdateXLM is playing out as planned so far, currently stuck in a cluster zone.
The next short opportunity is shaping up at the 0.382 fib, where it aligns with VWAP resistance and a liquidity area.
For targets, I’m looking at the 1.136 fib extension, which lines up well with VWAP support and liquidity below.
💡 Pro Tip
➡️ Look for entry points where fibs align with liquidity zones and other tools like VWAP, this creates a high-confluence zone, giving you the highest probability trade setups.
Stay patient, wait for confirmation and focus on quality over quantity!
הערה
🚨 XLM UpdateXLM’s target still remains in play, looking for a move toward the anchored VWAP from the $0.2228 low, which currently sits around $0.42, to sweep that liquidity.
The first short setup was from the 0.382 fib retracement + anchored VWAP from the $0.5206 high, which gave a clean rejection.
The next short opportunity was at the 0.618 fib retracement at $0.4934.
Short target remains ~$0.42–$0.40
עסקה סגורה: היעד הושג
This short trade took its time, but it finally hit the target with precision, bouncing right off the Key Level in confluence with the monthly support 🔥The long trade setup from that zone played out well too.
Great example of patience paying off on both sides. ✅📉📈
🏆 Mastering Fibonacci for precision trading
🔹 Sharing high-probability trade setups
⚡ Unlock the power of technical analysis!
🔹 Sharing high-probability trade setups
⚡ Unlock the power of technical analysis!
פרסומים קשורים
כתב ויתור
המידע והפרסומים אינם אמורים להיות, ואינם מהווים, עצות פיננסיות, השקעות, מסחר או סוגים אחרים של עצות או המלצות שסופקו או מאושרים על ידי TradingView. קרא עוד בתנאים וההגבלות.