Time Series Model Indicator
Hello,
I am releasing this time series modelling indicator.
Brief overview of the indicator's functionality:
The Time Series Model indicator is a technical analysis tool that calculates and visualizes a linear regression line based on historical price data. It assesses the trend direction and provides an outer band around the regression line to indicate potential support and resistance levels. The indicator also detects outliers in the price data and calculates correlations between the time variable and the closing price. It offers various customization options such as input length, user-defined hours in advance, display settings for tables and fills, and the ability to show variable correlations. Overall, this indicator aims to help traders identify trends, potential reversals, and price extremes in a given time series.
Specific Functions:
Slope Calculations: The indicator calculates the slope and intercept of the regression line using the specified length of assessment (user defined). It also computes the residuals, standard error of the regression, and the upper and lower bounds of the standard error region. Additionally, it calculates multiple standard deviation bands around the regression line. The slope will change to green if the stock is in an uptrend and to red if the stock is in a downtrend.
Outliers: This feature detects extreme positive and negative outliers based on the z-score calculated from the price data. It highlights the outliers with a red background color to red if this option is selected.
Correlation to Time Assessments: This feature performs trend assessments based on the correlation between time and price data. It identifies uptrends, downtrends, falling trends, rising trends, etc.
Outerband Plots: This feature plots the regression line, standard error bands, and multiple standard deviation bands around the regression line. It also fills the areas between these lines.
Trend Assessment: This feature further assesses the trend based on the strength of the correlation. It identifies strong up or down trends, moderate trends, weak trends, no trend, etc.
Linear Regression Time Data: This section retrieves price data (close, high, low, open) for the specified timeframe and stores them in arrays for a linear regression analysis.
Define LinReg Variables: This section calculates linear regression lines and their upper and lower control limits for the close, low and high prices. It also calculates the correlation between close price and time.
Manual assessments: This feature allows for the manual assessment of time series data. The user can input a look forward for hours in the future and get the predicted price range based on the current time relationship. See image below:

Calculating model "fit": The indicator will display the amount of time the stock closes within and outside its respective bands to ascertain the degree of "fit" (see image below):
Explanations:
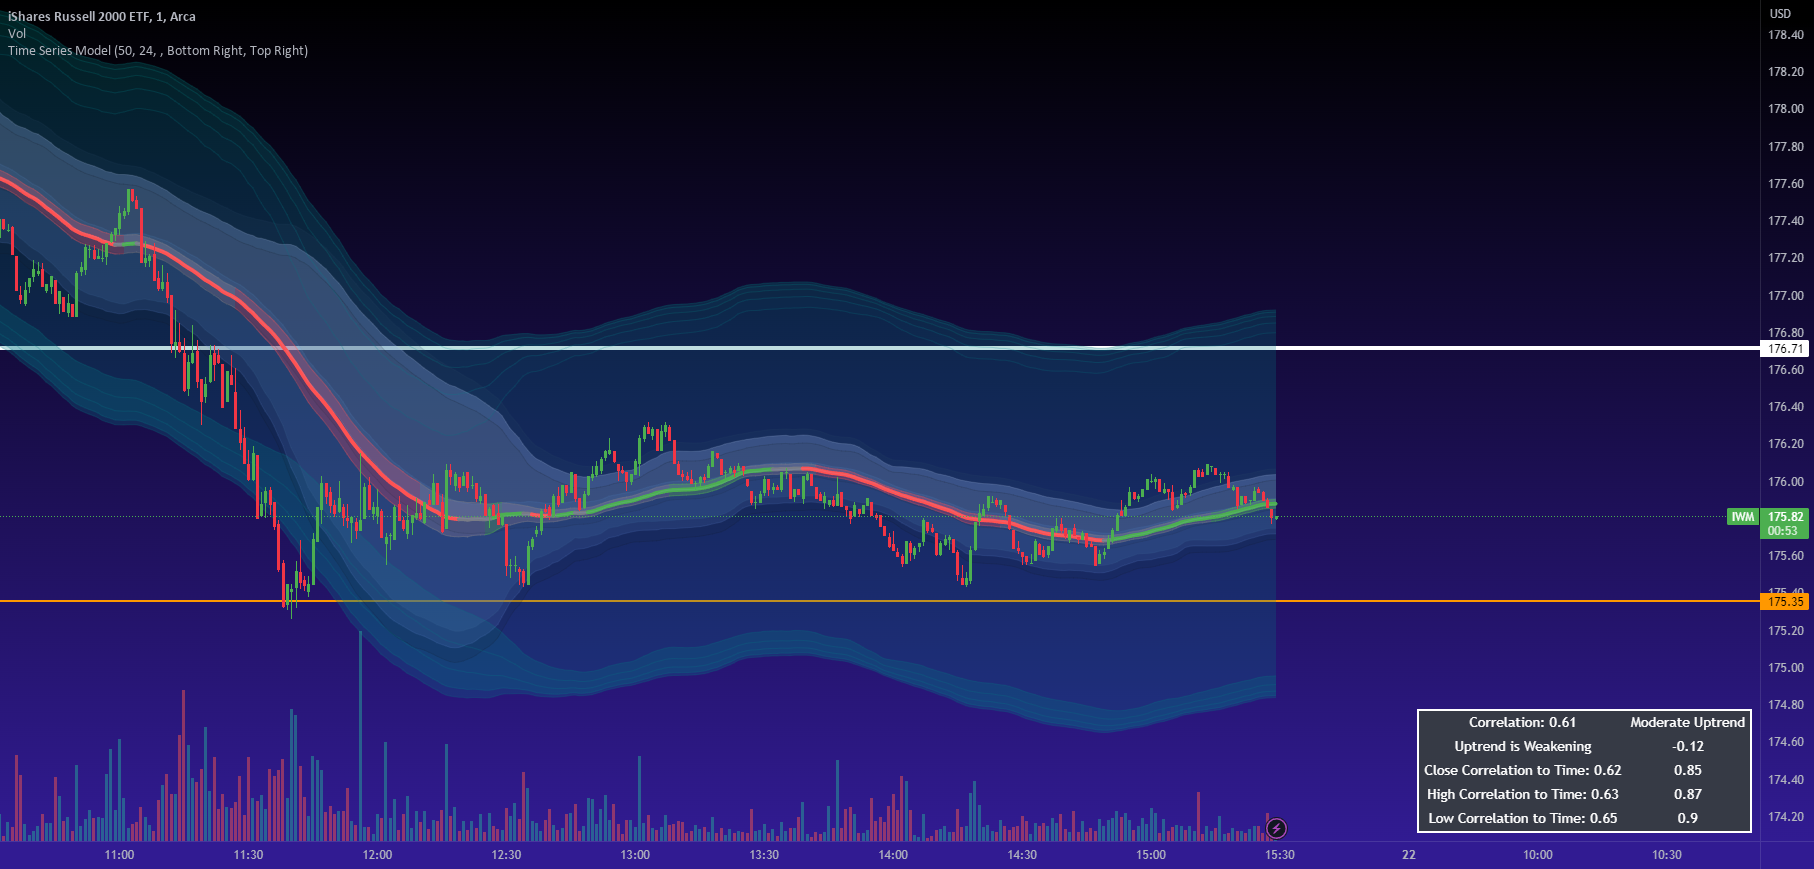
The outer cloud: The outer, tealish green cloud represents the regression line + 1.5 standard deviations from the regression line.
The inner cloud: The inner, white coloured cloud represents the immediate time series range calculated through regression of the open, high and low price of the ticker.
Correlations:
The ability of the indicator to calculate correlations on both the smaller and larger timeframes are its strongest feature. You can see the formation of trends by tracking the correlation over the length of the time series model's assessment. You can also track the degree of change. The image below shows the correlation table:
In this image, we can see that the stock is in a moderate downtrend manifested by a correlation of -0.73 (purple arrow).
This downtrend is weakening as manifested by a positive change of 0.05 on the shorter timeframe.
If we scroll down on the table and see the Close, High and Low, we can see that the larger trend over time is a downtrend and that this downtrend is actually strengthening. We know this by the negative change (negative change = significant inverse relationship to time is increasing. i.e. as time increases, the stock price decreases proportionately).
So what does negative correlation to time mean?
If a stock's price exhibits a negative correlation to time, it implies that there is a systematic relationship between the passage of time and the stock's price movement in the opposite direction. This finding could have several potential implications for traders and investors. Firstly, it suggests that the stock's price tends to decrease as time progresses, indicating a downward trend or bearish sentiment. This information might be useful for traders looking to capitalize on short-selling or hedging strategies. Secondly, it could indicate a potential opportunity to predict future price movements based on the timing of negative correlations. By understanding the relationship between time and price, investors may be able to make more informed decisions about when to buy or sell the stock. Lastly, a negative correlation to time may also suggest the influence of external factors or market conditions that systematically impact the stock's performance over time. Therefore, monitoring this correlation can provide insights into broader market dynamics and help investors better understand the stock's behavior.
What about a positive correlation to time?
If a stock's price demonstrates a positive correlation to time, it means that there is a consistent relationship between the passage of time and the stock's price movement in the same direction. This positive correlation to time can have significant implications for traders and investors. Firstly, it indicates a potential upward trend or bullish sentiment, suggesting that the stock's price tends to increase as time progresses. This information can be valuable for investors seeking long-term growth opportunities or looking to capitalize on upward price movements. Secondly, a positive correlation to time may provide insights into the stock's historical performance patterns and help identify potential buying or selling opportunities based on the timing of positive correlations. Additionally, understanding this correlation can aid in assessing the stock's overall trajectory and identifying potential market trends. It's important to note that positive correlation to time does not guarantee future performance, but it can offer valuable information to inform investment decisions.
Because this indicator is pretty big, I have done an overview and tutorial video which I will link below:
As always, please leave your comments and suggestions below.
I thank you for taking the time to read and check out this indicator.
Safe trades everyone and enjoy your weekend!
I am releasing this time series modelling indicator.
Brief overview of the indicator's functionality:
The Time Series Model indicator is a technical analysis tool that calculates and visualizes a linear regression line based on historical price data. It assesses the trend direction and provides an outer band around the regression line to indicate potential support and resistance levels. The indicator also detects outliers in the price data and calculates correlations between the time variable and the closing price. It offers various customization options such as input length, user-defined hours in advance, display settings for tables and fills, and the ability to show variable correlations. Overall, this indicator aims to help traders identify trends, potential reversals, and price extremes in a given time series.
Specific Functions:
Slope Calculations: The indicator calculates the slope and intercept of the regression line using the specified length of assessment (user defined). It also computes the residuals, standard error of the regression, and the upper and lower bounds of the standard error region. Additionally, it calculates multiple standard deviation bands around the regression line. The slope will change to green if the stock is in an uptrend and to red if the stock is in a downtrend.
Outliers: This feature detects extreme positive and negative outliers based on the z-score calculated from the price data. It highlights the outliers with a red background color to red if this option is selected.
Correlation to Time Assessments: This feature performs trend assessments based on the correlation between time and price data. It identifies uptrends, downtrends, falling trends, rising trends, etc.
Outerband Plots: This feature plots the regression line, standard error bands, and multiple standard deviation bands around the regression line. It also fills the areas between these lines.
Trend Assessment: This feature further assesses the trend based on the strength of the correlation. It identifies strong up or down trends, moderate trends, weak trends, no trend, etc.
Linear Regression Time Data: This section retrieves price data (close, high, low, open) for the specified timeframe and stores them in arrays for a linear regression analysis.
Define LinReg Variables: This section calculates linear regression lines and their upper and lower control limits for the close, low and high prices. It also calculates the correlation between close price and time.
Manual assessments: This feature allows for the manual assessment of time series data. The user can input a look forward for hours in the future and get the predicted price range based on the current time relationship. See image below:
Calculating model "fit": The indicator will display the amount of time the stock closes within and outside its respective bands to ascertain the degree of "fit" (see image below):
The outer cloud: The outer, tealish green cloud represents the regression line + 1.5 standard deviations from the regression line.
The inner cloud: The inner, white coloured cloud represents the immediate time series range calculated through regression of the open, high and low price of the ticker.
Correlations:
The ability of the indicator to calculate correlations on both the smaller and larger timeframes are its strongest feature. You can see the formation of trends by tracking the correlation over the length of the time series model's assessment. You can also track the degree of change. The image below shows the correlation table:
In this image, we can see that the stock is in a moderate downtrend manifested by a correlation of -0.73 (purple arrow).
This downtrend is weakening as manifested by a positive change of 0.05 on the shorter timeframe.
If we scroll down on the table and see the Close, High and Low, we can see that the larger trend over time is a downtrend and that this downtrend is actually strengthening. We know this by the negative change (negative change = significant inverse relationship to time is increasing. i.e. as time increases, the stock price decreases proportionately).
So what does negative correlation to time mean?
If a stock's price exhibits a negative correlation to time, it implies that there is a systematic relationship between the passage of time and the stock's price movement in the opposite direction. This finding could have several potential implications for traders and investors. Firstly, it suggests that the stock's price tends to decrease as time progresses, indicating a downward trend or bearish sentiment. This information might be useful for traders looking to capitalize on short-selling or hedging strategies. Secondly, it could indicate a potential opportunity to predict future price movements based on the timing of negative correlations. By understanding the relationship between time and price, investors may be able to make more informed decisions about when to buy or sell the stock. Lastly, a negative correlation to time may also suggest the influence of external factors or market conditions that systematically impact the stock's performance over time. Therefore, monitoring this correlation can provide insights into broader market dynamics and help investors better understand the stock's behavior.
What about a positive correlation to time?
If a stock's price demonstrates a positive correlation to time, it means that there is a consistent relationship between the passage of time and the stock's price movement in the same direction. This positive correlation to time can have significant implications for traders and investors. Firstly, it indicates a potential upward trend or bullish sentiment, suggesting that the stock's price tends to increase as time progresses. This information can be valuable for investors seeking long-term growth opportunities or looking to capitalize on upward price movements. Secondly, a positive correlation to time may provide insights into the stock's historical performance patterns and help identify potential buying or selling opportunities based on the timing of positive correlations. Additionally, understanding this correlation can aid in assessing the stock's overall trajectory and identifying potential market trends. It's important to note that positive correlation to time does not guarantee future performance, but it can offer valuable information to inform investment decisions.
Because this indicator is pretty big, I have done an overview and tutorial video which I will link below:
As always, please leave your comments and suggestions below.
I thank you for taking the time to read and check out this indicator.
Safe trades everyone and enjoy your weekend!
Premium indicators and content have launched! Get access at: www.patreon.com/steversteves