MESA Stochastic Multi LengthJohn Ehler's MESA Stochastic uses super smoothing to give solid signals. This indicator uses the same rules as every other Stochastic indicator so it would be worth looking into if you are not already familiar with reading a Stochastic. There are 4 different lengths displayed to give traders an edge on reading the market. This is a great tool to analyze waves and find tops and bottoms. It gives great pump and dump signals and even helps filter out bad trades when used with other indicators such as Boom Hunter.
Below are some examples of signals to look out for:
oo
Highsandlows

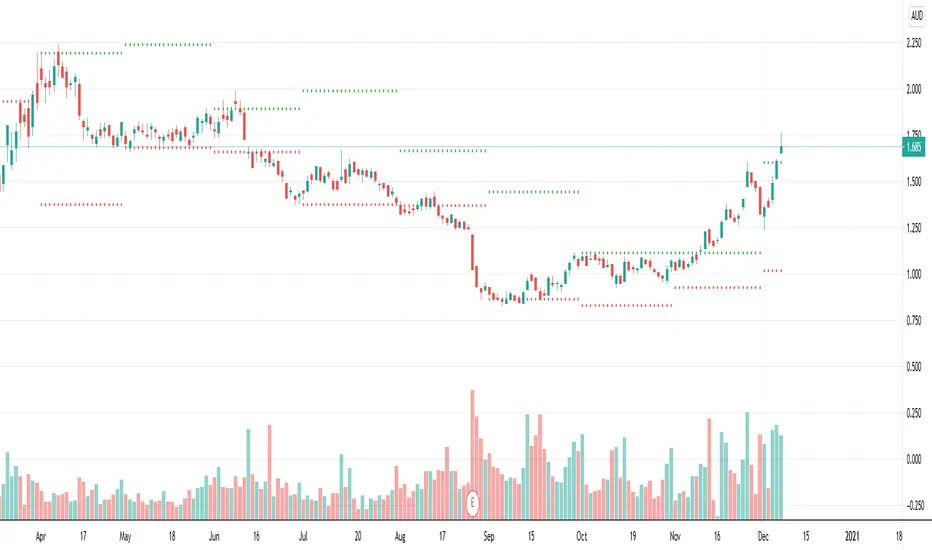
Previous High/Low MTFIndicator to plot higher time frame previous candle highs and lows.
One of the key factor in understanding the trend is to look at higher time-frames chart.
Parameters are explained below:
resolution : Chose resolution of higher timeframe. If set to same as symbol, it will consider next parameter HTFMultiplier for calculation of higher timeframe
HTFMultiplier : Multiply symbol timeframe to by HTFMultiplier to derive higher time-frame
Offset : Number of higher timeframe candles before to be plotted. 1 means - it will show highs/lows of previous higher timeframe candle.
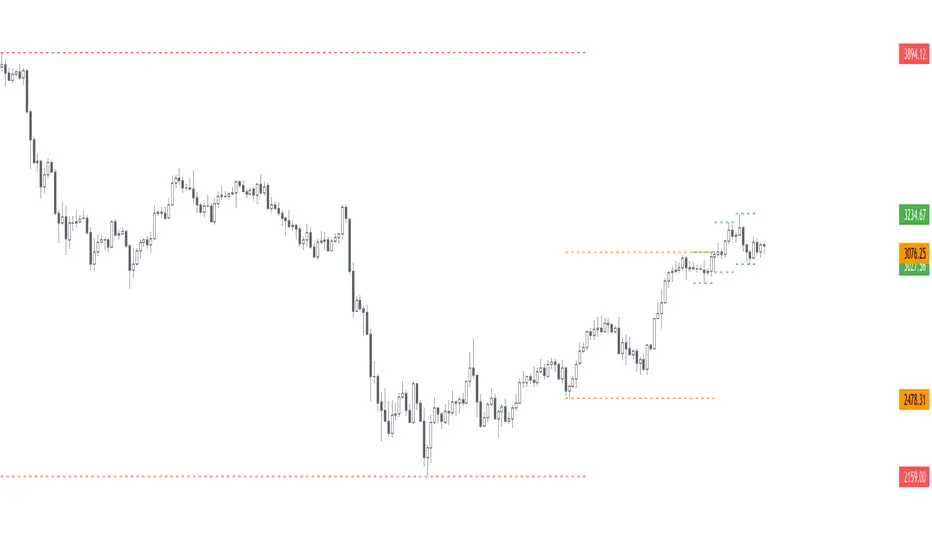
Prevous High & Low by Period + NY Zone
This is based on various example code and research done to try and help using the free ICT OTE Pattern on the NY 08:30 to 11:00 am
I tried to make this work on multiple time frames and settings but its best below 8hr
Legend (some of these are for fun and working examples)
RED BG color = Sunday Trading
MAROON STAR = Experiment in significant movement over the last 3 bars
Blue X = Engulfing Candle Marker
I have used this script as a building basis and research contributed by various sources on the internet. Its for learning purposes and helping to draw some lines.

Previous Day Week Highs & LowsThis script plots the previous n day and week highs and lows (previous two days and previous week by default).
Here are some additional info about the script behavior:
Plots highs and/or lows
Plots for days and/or weeks
Day highs and lows are shown only on intraday timeframes
Week highs and lows are shown only on timeframes < weekly