BTC - The amazing 2013 fractal
The amazing 2013 fractal just keeps on giving. As some might already be aware,
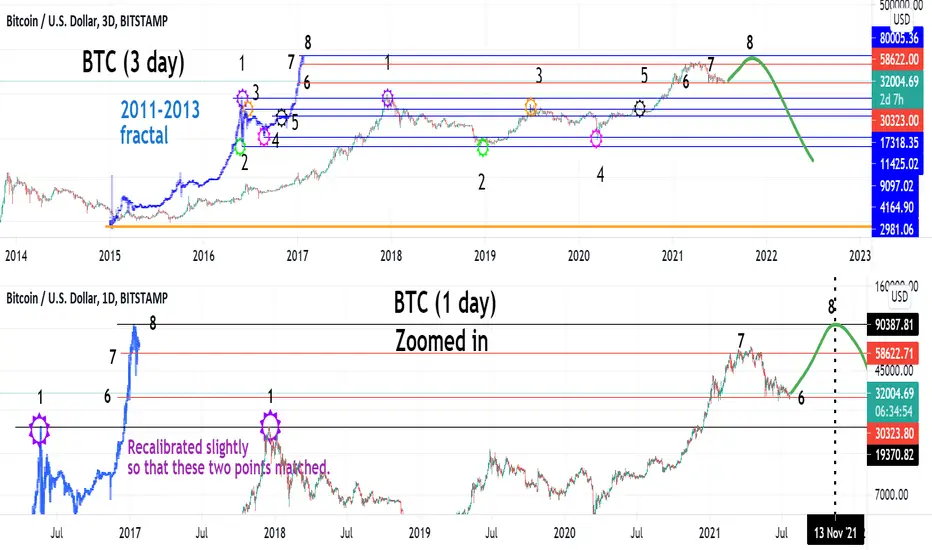
the current bull run has been matching the 2011-2013 bull run fractal, starting January 2015.
To get even more amazing, the 50% dip in 2013 matches with the current dip.
If the fractal magic can be believed, this dip has reached its low.
The top chart would give a BTC top of about 80k to 83K
83K
The bottom chart, I recalibrated the fractal slightly to get points 1 to match. Then BTC top can be about 90k
Take it it with a grain of salt gents and ladies. It is a fractal. But one hell of a fractal.
the current bull run has been matching the 2011-2013 bull run fractal, starting January 2015.
To get even more amazing, the 50% dip in 2013 matches with the current dip.
If the fractal magic can be believed, this dip has reached its low.
The top chart would give a BTC top of about 80k to
The bottom chart, I recalibrated the fractal slightly to get points 1 to match. Then BTC top can be about 90k
Take it it with a grain of salt gents and ladies. It is a fractal. But one hell of a fractal.
הערה
By the way, on the bottom graph, I had used 12 hour to match the points 6 & 7 (dip levels), then went back to 1 day.הערה
This is the 2013 dip of 50% by the way.הערה
Learned about 2013 fractal from Blockchain Backer by the way. I didn't find it.כתב ויתור
המידע והפרסומים אינם אמורים להיות, ואינם מהווים, עצות פיננסיות, השקעות, מסחר או סוגים אחרים של עצות או המלצות שסופקו או מאושרים על ידי TradingView. קרא עוד בתנאים וההגבלות.