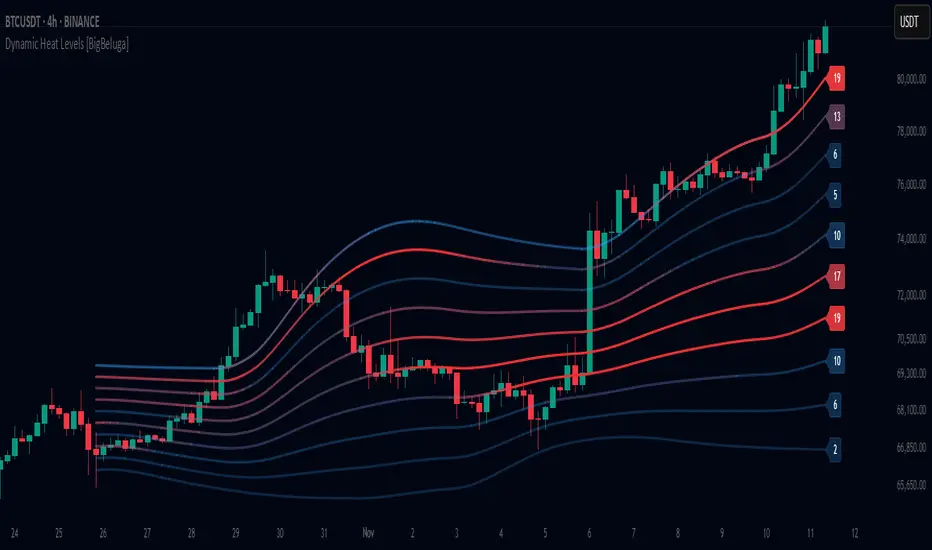
Dynamic Heat Levels [BigBeluga]This indicator visualizes dynamic support and resistance levels with an adaptive heatmap effect. It helps traders identify key price interaction zones and potential mean reversion opportunities by displaying multiple levels that react to price movement.
🔵Key Features:
Multi-Level Heatmap Channel:
- The indicator plots multiple dynamic levels forming a structured channel.
- Each level represents a historical price interaction zone, helping traders identify critical areas.
- The channel expands or contracts based on market conditions, adapting dynamically to price movements.
Heatmap-Based Strength Indication:
- Levels change in transparency and color intensity based on price interactions for the length period .
- The more frequently price interacts with a level, the more visible and intense the color becomes.
- When a level reaches a threshold (count > 10), it starts to turn red, signaling a high-heat zone with significant price activity.
🔵Usage:
Support & Resistance Analysis: Identify price levels where the market frequently interacts, making them strong areas for trade decisions.
Heatmap Strength Assessment: More intense red levels indicate areas with heavy price activity, useful for detecting key liquidity zones.
Dynamic Heat Levels is a powerful tool for traders looking to analyze price interaction zones with a heatmap effect. It offers a structured visualization of market dynamics, allowing traders to gauge the significance of key levels and detect mean reversion setups effectively.
אינדיקטורים ואסטרטגיות
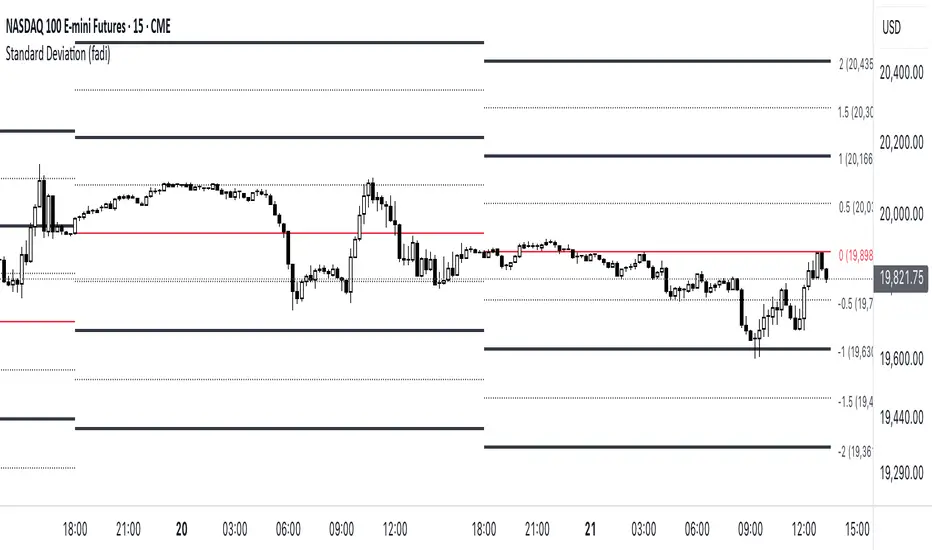
Standard Deviation (fadi)The Standard Deviation indicator uses standard deviation to map out price movements. Standard deviation measures how much prices stray from their average—small values mean steady trends, large ones mean wild swings. Drawing from up to 20 years of data, it plots key levels using customizable Fibonacci lines tied to that standard deviation, giving traders a snapshot of typical price behavior.
These levels align with a bell curve: about 68% of price moves stay within 1 standard deviation, 95% within roughly 2, and 99.7% within roughly 3. When prices break past the 1 StDev line, they’re outliers—only 32% of moves go that far. Prices often snap back to these lines or the average, though the reversal might not happen the same day.
How Traders Use It
If prices surge past the 1 StDev line, traders might wait for momentum to fade, then trade the pullback to that line or the average, setting a target and stop.
If prices dip below, they might buy, anticipating a bounce—sometimes a day or two later. It’s a tool to spot overstretched prices likely to revert and/or measure the odds of continuation.
Settings
Higher Timeframe: Sets the Higher Timeframe to calculate the Standard Deviation for
Show Levels for the Last X Days: Displays levels for the specified number of days.
Based on X Period: Number of days to calculate standard deviation (e.g., 20 years ≈ 5,040 days). Larger periods smooth out daily level changes.
Mirror Levels on the Other Side: Plots symmetric positive and negative levels around the average.
Fibonacci Levels Settings: Defines which levels and line styles to show. With mirroring, negative values aren’t needed.
Background Transparency: Turn on Background color derived from the level colors with the specified transparency
Overrides: Lets advanced users input custom standard deviations for specific tickers (e.g., NQ1! at 0.01296).
[blackcat] L2 Risk Assessment for Trend StrengthOVERVIEW
This script provides an advanced technical analysis tool combining real-time **Risk Assessment** and **Trend Strength Indicators**, displayed independently from price charts. It calculates multi-layered metrics using weighted algorithms and visualizes risk thresholds via dynamically-colored zones.
FEATURES
- Dual ** RISKA ** calculations ( RSVA1 / RSVA2 ) across 9-period cycles
- Smoothed outputs via proprietary **boldWeighted Moving Averages (WMAs)**
- Dynamic **Current Safety Level Plot** (fuchsia area-style visualization)
- Color-coded **Trend Strength Line** reacting to real-time shifts across four danger/optimism tiers
- Automated threshold validation mechanism using last-valid-value logic
- Visually distinct risk zones (blue/green/yellow/red/fuchsia) filling background areas
HOW TO USE
1. Add to your chart to observe two core elements:
- Area plot showing current risk tolerance buffer
- Thick line indicating momentum strength direction
2. Interpret values relative to vertical thresholds:
• Above 100 = Ultra-safe zone (light blue)
• 80–100 = Safe zone (green)
• 20–80 = Moderate/high-risk zones (yellow)
• Below 20 = Extreme risk (red)
3. Monitor trend confidence shifts using the colored line:
> **Blue**: Strong bullish momentum (>80%)
> **Green/Yellow**: Neutral/moderate trends (50%-80%)
> **Red**: Bearish extremes (<20%)
LIMITATIONS
• Relies heavily on prior 33-period low and 21-period high volatility patterns
• WMA smoothing introduces minor backward-looking bias
• Not optimized for intraday timeframe sub-hourly usage
• Excessive weighting parameters may amplify noise during sideways markets

_rerun Day trade signalsThis strategy is designed for day trading index funds like SPX, SPY, QQQ, and others on a 10-minute timeframe. It uses simple indicators like EMA crossovers and RSI to identify solid entry points during bullish trends. The strategy aims to capture quick profits while minimizing risk, using multiple exit points to lock in gains and protect capital. By focusing on well-timed entries and exits, it ensures high probability trades with manageable risk.
The system is built for options traders buying contracts in multiples of 3, with three clearly defined profit-taking exits. The first exit locks in a quick gain, the second captures a larger move, and the final exit uses a trailing stop to ride further upside. This approach balances early profit-taking with letting profits run, making it a robust strategy for volatile markets.

Adept AcademyExclusive Access for Adept Academy Members
This indicator is a proprietary tool, meticulously engineered to provide unparalleled market insights. Its availability has been strictly limited to authorized members of Adept Academy, reflecting our commitment to maintaining a competitive edge. Accessing this resource signifies your alignment with the highest standards of trading excellence.
However, in an act of generosity, I’ve chosen to make this indicator public. Please note that this release contains no content from the private mentorship program — it remains a separate, premium offering exclusive to Adept Academy members.
Unauthorized distribution, reproduction, or misuse of this indicator remains a direct violation of our terms and may result in immediate revocation of access, alongside potential legal action. We uphold the integrity of our community and the exclusivity of our resources.
Enjoy, and trade responsibly.
Yours Truly,
Mulano

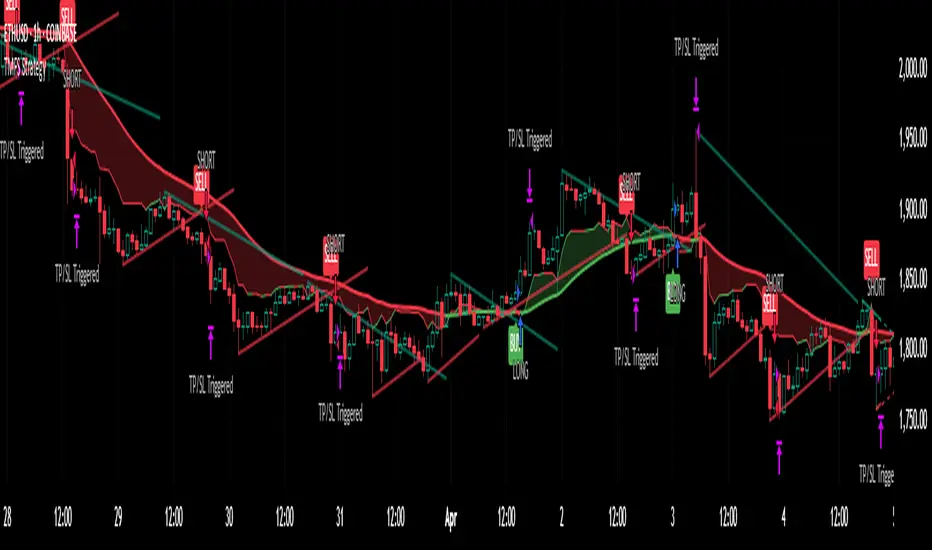
Trendline Breaks with Multi Fibonacci Supertrend StrategyTMFS Strategy: Advanced Trendline Breakouts with Multi-Fibonacci Supertrend
Elevate your algorithmic trading with institutional-grade signal confluence
Strategy Genesis & Evolution
This advanced trading system represents the culmination of a personal research journey, evolving from my custom " Multi Fibonacci Supertrend with Signals " indicator into a comprehensive trading strategy. Built upon the exceptional trendline detection methodology pioneered by LuxAlgo in their " Trendlines with Breaks " indicator, I've engineered a systematic framework that integrates multiple technical factors into a cohesive trading system.
Core Fibonacci Principles
At the heart of this strategy lies the Fibonacci sequence application to volatility measurement:
// Fibonacci-based factors for multiple Supertrend calculations
factor1 = input.float(0.618, 'Factor 1 (Weak/Fibonacci)', minval = 0.01, step = 0.01)
factor2 = input.float(1.618, 'Factor 2 (Medium/Golden Ratio)', minval = 0.01, step = 0.01)
factor3 = input.float(2.618, 'Factor 3 (Strong/Extended Fib)', minval = 0.01, step = 0.01)
These precise Fibonacci ratios create a dynamic volatility envelope that adapts to changing market conditions while maintaining mathematical harmony with natural price movements.
Dynamic Trendline Detection
The strategy incorporates LuxAlgo's pioneering approach to trendline detection:
// Pivotal swing detection (inspired by LuxAlgo)
pivot_high = ta.pivothigh(swing_length, swing_length)
pivot_low = ta.pivotlow(swing_length, swing_length)
// Dynamic slope calculation using ATR
slope = atr_value / swing_length * atr_multiplier
// Update trendlines based on pivot detection
if bool(pivot_high)
upper_slope := slope
upper_trendline := pivot_high
else
upper_trendline := nz(upper_trendline) - nz(upper_slope)
This adaptive trendline approach automatically identifies key structural market boundaries, adjusting in real-time to evolving chart patterns.
Breakout State Management
The strategy implements sophisticated state tracking for breakout detection:
// Track breakouts with state variables
var int upper_breakout_state = 0
var int lower_breakout_state = 0
// Update breakout state when price crosses trendlines
upper_breakout_state := bool(pivot_high) ? 0 : close > upper_trendline ? 1 : upper_breakout_state
lower_breakout_state := bool(pivot_low) ? 0 : close < lower_trendline ? 1 : lower_breakout_state
// Detect new breakouts (state transitions)
bool new_upper_breakout = upper_breakout_state > upper_breakout_state
bool new_lower_breakout = lower_breakout_state > lower_breakout_state
This state-based approach enables precise identification of the exact moment when price breaks through a significant trendline.
Multi-Factor Signal Confluence
Entry signals require confirmation from multiple technical factors:
// Define entry conditions with multi-factor confluence
long_entry_condition = enable_long_positions and
upper_breakout_state > upper_breakout_state and // New trendline breakout
di_plus > di_minus and // Bullish DMI confirmation
close > smoothed_trend // Price above Supertrend envelope
// Execute trades only with full confirmation
if long_entry_condition
strategy.entry('L', strategy.long, comment = "LONG")
This strict requirement for confluence significantly reduces false signals and improves the quality of trade entries.
Advanced Risk Management
The strategy includes sophisticated risk controls with multiple methodologies:
// Calculate stop loss based on selected method
get_long_stop_loss_price(base_price) =>
switch stop_loss_method
'PERC' => base_price * (1 - long_stop_loss_percent)
'ATR' => base_price - long_stop_loss_atr_multiplier * entry_atr
'RR' => base_price - (get_long_take_profit_price() - base_price) / long_risk_reward_ratio
=> na
// Implement trailing functionality
strategy.exit(
id = 'Long Take Profit / Stop Loss',
from_entry = 'L',
qty_percent = take_profit_quantity_percent,
limit = trailing_take_profit_enabled ? na : long_take_profit_price,
stop = long_stop_loss_price,
trail_price = trailing_take_profit_enabled ? long_take_profit_price : na,
trail_offset = trailing_take_profit_enabled ? long_trailing_tp_step_ticks : na,
comment = "TP/SL Triggered"
)
This flexible approach adapts to varying market conditions while providing comprehensive downside protection.
Performance Characteristics
Rigorous backtesting demonstrates exceptional capital appreciation potential with impressive risk-adjusted metrics:
Remarkable total return profile (1,517%+)
Strong Sortino ratio (3.691) indicating superior downside risk control
Profit factor of 1.924 across all trades (2.153 for long positions)
Win rate exceeding 35% with balanced distribution across varied market conditions
Institutional Considerations
The strategy architecture addresses execution complexities faced by institutional participants with temporal filtering and date-range capabilities:
// Time Filter settings with flexible timezone support
import jason5480/time_filters/5 as time_filter
src_timezone = input.string(defval = 'Exchange', title = 'Source Timezone')
dst_timezone = input.string(defval = 'Exchange', title = 'Destination Timezone')
// Date range filtering for precise execution windows
use_from_date = input.bool(defval = true, title = 'Enable Start Date')
from_date = input.time(defval = timestamp('01 Jan 2022 00:00'), title = 'Start Date')
// Validate trading permission based on temporal constraints
date_filter_approved = time_filter.is_in_date_range(
use_from_date, from_date, use_to_date, to_date, src_timezone, dst_timezone
)
These capabilities enable precise execution timing and market session optimization critical for larger market participants.
Acknowledgments
Special thanks to LuxAlgo for the pioneering work on trendline detection and breakout identification that inspired elements of this strategy. Their innovative approach to technical analysis provided a valuable foundation upon which I could build my Fibonacci-based methodology.
This strategy is shared under the same Attribution-NonCommercial-ShareAlike 4.0 International (CC BY-NC-SA 4.0) license as LuxAlgo's original work.
Past performance is not indicative of future results. Conduct thorough analysis before implementing any algorithmic strategy.
Quantum Motion Oscillator-QMO (TechnoBlooms)Quantum Motion Oscillator (QMO) is a momentum indicator designed for traders who demand precision. Combining multi-timeframe weighted linear regression with EMA crossovers, QMO offers a dynamic view of market momentum, helping traders anticipate trend shifts with greater accuracy.
This oscillator is inspired by quantum mechanics and wave theory, where market movement is seen as a series of probabilistic waves rather than rigid structures.
The histogram is plotted in proportion to the price movement of the candlesticks.
KEY FEATURES
1. Multi-Timeframe Histogram - Integrates 1 to 5 weighted linear regression averages, reducing lag while maintaining accuracy.
2. EMA Crossover Signal - Uses a Short and Long EMA to confirm trend shifts with minimal noise.
3. Adaptive Trend Analysis - Self-adjusting mechanics make QMO effective in both ranging and trending markets.
4. Scalable for Different Trading Styles - Works seamlessly for scalping, intraday, swing and position trading.
ADVANCED PROFESSIONAL INSIGHTS
1. Wave Dynamics and Market Flow - Inspired by wave mechanics, QMO reflects the energy accumulation and dissipation in price movements.
Expanding histogram waves = Strong momentum surge
Contracting waves = Momentum weakening, potential reversal zone.
2. Liquidity and Order Flow Applications - QMO works well alongside liquidity concepts and smart money techniques:
Combine with Fair Value Gaps & Order Blocks -> Enter when QMO signals align with liquidity zones.
Avoid False Moves - If price sweeps liquidity, but QMO momentum diverges, it is a sign of potential smart money manipulation.

Čičimoku Cloud (BTC)📌 Čičimoku Cloud (Pine Script Indicator for TradingView)
This indicator, called Čičimoku Cloud, is my own implementation of the traditional Ichimoku Cloud, which I regularly use for trading Bitcoin. The purpose of this indicator is to simplify the identification of trends, key support and resistance levels, and to provide a clearer visualization of the current market sentiment.
📖 What exactly does this indicator do?
This is a complete Ichimoku Cloud with the following components:
✅ Conversion Line (Tenkan-sen): A faster-moving average that shows short-term market direction.
✅ Base Line (Kijun-sen): A slower-moving average that serves as medium-term support or resistance.
✅ Lagging Span (Chikou Span): Compares the current price with previous price levels, helping to determine trend strength.
✅ Leading Span A (Senkou Span A): The midpoint between the Conversion Line and Base Line, shifted forward.
✅ Leading Span B (Senkou Span B): The average of the highest high and lowest low over a longer period, shifted forward.
🌫️ Cloud (Kumo): Formed between Leading Span A and B, providing a visual overview of trends (green = bullish, red = bearish).
🔍 How to use this indicator?
If the price closes above the cloud, it indicates a bullish trend.
If the price closes below the cloud, it indicates a bearish trend.
Thin cloud: Weak support or resistance.
Thick cloud: Strong support or resistance.
💡 Why did I create this indicator?
The Ichimoku Cloud is one of my key tools when analyzing Bitcoin because it offers a comprehensive view of the trend and market strength. I’ve adjusted this indicator to work with Pine Script version 6, ensuring it functions smoothly on TradingView.

Edge Explorer by VivekEdge Explorer by Vivek: Comprehensive Multi-Feature Trading Indicator.
Edge Explorer is a versatile and robust trading indicator offering advanced tools for technical analysis. This all-in-one script seamlessly integrates pivotal trading strategies, empowering traders to identify critical levels, supply and demand zones, and pivot points with ease. By delivering insights into market trends and price movements, Edge Explorer enhances precision and decision-making. With customizable settings and clear visualizations, it’s the ultimate tool for maximizing trading efficiency and strategy
🔑 Core Features:
Camarilla Pivot Points: Calculates and plots key support and resistance levels using the Camarilla method.
Central Pivot Range (CPR): Visualizes the crucial Central Pivot Range (TC, PP, BC) to identify trend reversals and breakout zones.
PEMA (Progressive EMA): Displays Fast, Middle, and Slow Exponential Moving Averages with trend-based coloring and fill.
VWAP (Volume Weighted Average Price): Displays Fast, Middle, and Slow Exponential Moving Averages with trend-ased coloring and fill.
Supertrend Indicator: Employs ATR-based calculations to identify uptrends and downtrends dynamically.
Hull Suite: Displays buy and sell signals based on Hull MA's slope changes.
Supply & Demand Zones: Automatically identifies key support and resistance zones based on market structure. Highlights broken zones for actionable insights with alert conditions.
Multi-Timeframe Options: Flexible timeframe settings, including Daily, Weekly, Monthly, Quarterly, and custom multi-year intervals.
🎯 Why Use Edge Explorer?:
Streamlined visualization of essential levels and trends.
Combines various trading tools into a single, user-friendly indicator.
Customizable inputs and alerts to suit individual trading styles.
📊 How to Use:
Add Edge Explorer by Vivek to your TradingView chart and configure the settings to your preferences.
Utilize the Camarilla pivots, CPR, and Supply/Demand Zones for precise entry and exit points.
Monitor the Supertrend, Hull Suite, and PEMA for trend confirmation and dynamic signals.
Take advantage of VWAP to track intraday price action with volume influence.

Thien ThienFair Value Gap indicator: Paints FVGs and their midlines (CEs). Stops painting when CE is hit, or when fully filled; user choice of threshold. This threshold is also used in the Alert conditions.
~~Plotted here on ES1! (CME), on the 15m timeframe~~
-A FVG represents a 'naked' body where the wicks/tails on either side do not meet. This can be seen as a type of 'gap', which price will have a tendency to want to re-fill (in part or in full).
-The midline (CE, or 'Consequent encroachment') of FVGs also tend to show price sensitivity.
-This indicator paints all FVGs until priced into, and should give an idea of which are more meaningful and which are best ignored (based on context: location, Time of day, market structure, etc).
-This is a simpler and more efficient method of painting Fair value gaps which auto-stop painting when price reaches them.
//Aims of Publishing:
-Education of ICT concepts of Fair Value Gaps and their midlines (CEs): To easily see via forward testing or backtesting, the sensitivity that price shows to these areas & levels.
-Demonstration of a much more efficient way of plotting FVGs which terminate at price, thanks to a modification of @Bjorgums's clever looping method referenced below.
//Settings:
-Toggle on/off upward and downward FVGs independe

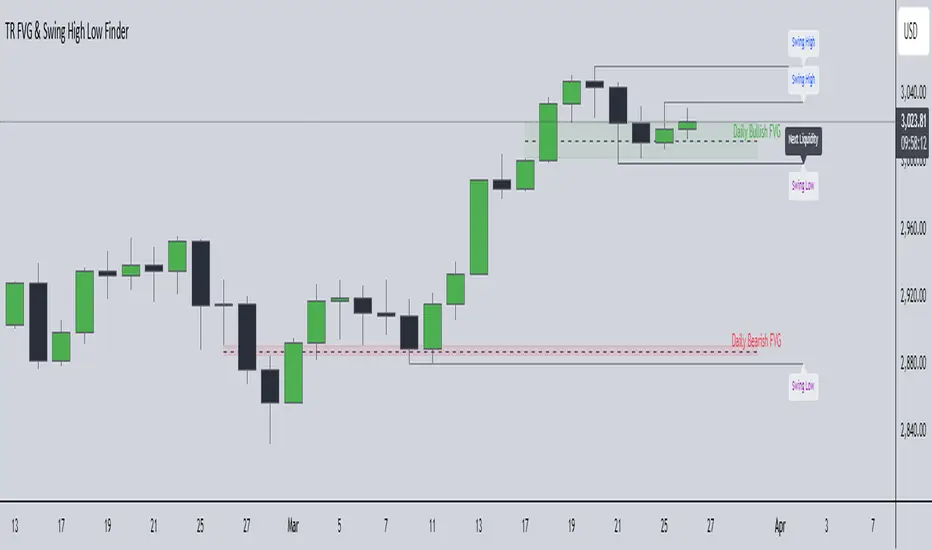
TR FVG & Swing High Low FinderTR FVG & Swing Level Finder
Overview:
The TR FVG & Swing Level Finder is a powerful Pine Script indicator designed for traders who want to identify Fair Value Gaps (FVGs) and Swing Highs/Lows on their charts. This indicator combines two essential technical analysis tools into one, helping traders spot potential areas of support, resistance, and trend reversals. FVGs are price gaps that often act as areas of interest for price to return to, while swing highs and lows help identify key turning points in the market. The indicator is highly customizable, allowing users to adjust colors, limits, and display options to suit their trading style.
Key Features:
1: Fair Value Gap (FVG) Detection:
- Identifies Bullish FVGs: Occur when the high of two candles ago is lower than the low of the current candle, indicating a potential upward price movement.
- Identifies Bearish FVGs: Occur when the low of two candles ago is higher than the high of the current candle, indicating a potential downward price movement.
- Displays FVGs as colored boxes on the chart, with customizable border and fill colors based on the timeframe.
- Labels each FVG box with the corresponding timeframe (e.g., "1m FVG", "1h FVG", "Daily FVG").
2: Swing High and Swing Low Detection:
- Detects Swing Highs: A 3-candle pattern where the middle candle's high is higher than the highs of the candles on either side.
- Detects Swing Lows: A 3-candle pattern where the middle candle's low is lower than the lows of the candles on either side.
- Draws a solid black line with 50% opacity at each swing high and low, extending 5 bars to the right for better visibility.
- Adds a small Swing High or Swing Low label at the right end of each line, colored according to user-defined settings.
3: Timeframe-Specific FVG Visualization:
- FVGs are color-coded based on the chart's timeframe, making it easy to distinguish between FVGs on different timeframes.
- Each timeframe has its own fill color for bullish and bearish FVGs, with adjustable transparency for better chart clarity.
- A dashed black line is drawn in the middle of each FVG box to highlight the midpoint of the gap.
4: Customizable Display Options:
- FVG Limit: Control the maximum number of FVGs displayed on the chart (from 1 to 20).
- Extend Options for FVG Boxes:
- "None": FVG boxes extend only 2 bars to the right.
- "Limited": FVG boxes extend a user-defined number of candles to the right (1 to 100 candles).
- "Default": FVG boxes extend 3 bars to the right of the current bar.
- Color Customization:
- Set border colors for bullish and bearish FVGs.
- Adjust fill colors for FVGs on different timeframes (1m, 5m, 15m, 30m, 1h, 4h, Daily, Weekly, Monthly).
- Customize the colors of swing high and swing low labels.
5: Performance Optimization:
- The indicator only plots FVGs and swings on the last confirmed bar (barstate.islastconfirmedhistory), ensuring efficient performance and reducing chart clutter.
- Limits the number of displayed FVGs and swings to the user-defined fvgLimit, keeping the chart clean and focused on the most recent price action.
6: Inputs and Customization:
- Number of FVGs to Show (fvgLimit): Set the maximum number of FVGs and swings to display (default: 3, range: 1 to 20).
- Bullish FVG Border Color (bullishColor): Choose the border color for bullish FVGs (default: green).
- Bearish FVG Border Color (bearishColor): Choose the border color for bearish FVGs (default: red).
- Swing High Color (swingHighColor): Set the color for swing high labels (default: blue).
- Swing Low Color (swingLowColor): Set the color for swing low labels (default: purple).
- Extend Options:
- Extend Option (extendOption): Choose how far FVG boxes extend to the right ("None", "Limited", or "Default"; default: "Default").
- Extend Candles (extendCandles): If "Limited" is selected, specify the number of candles to extend FVG boxes (default: 8, range: 1 to 100).
- Timeframe-Specific Fill Colors:
- Customize fill colors for bullish and bearish FVGs on various timeframes (1m, 5m, 15m, 30m, 1h, 4h, Daily, Weekly, Monthly).
- Each fill color has a default transparency (e.g., 93% for most timeframes, 90% for 30m), which can be adjusted as needed.
How to Use:
1: Add the Indicator to Your Chart:
- Open TradingView, go to the Pine Editor, and paste the script.
- Click "Add to Chart" to apply the indicator to your current chart.
2: Adjust Settings:
- Open the indicator settings by clicking the gear icon next to the indicator name on your chart.
- Modify the inputs to suit your preferences:
- Set the number of FVGs and swings to display.
- Choose your preferred colors for FVGs and swings.
- Adjust the extend options for FVG boxes.
3: Interpret the Indicator:
- FVG Boxes: Look for colored boxes on the chart, which represent Fair Value Gaps. Bullish FVGs (green borders by default) suggest potential buying opportunities, while bearish FVGs (red borders by default) suggest potential selling opportunities. The label inside each box indicates the timeframe of the FVG.
- Swing Highs and Lows: Identify key turning points with solid black lines (50% opacity) at swing highs and lows. Each line extends 5 bars to the right, with an "SH" (Swing High) or "SL" (Swing Low) label at the end. Swing highs can act as resistance levels, while swing lows can act as support levels.
4: Combine with Your Strategy:
- Use FVGs to identify areas where price might return to fill the gap, often acting as support or resistance.
- Use swing highs and lows to spot potential trend reversals or to set stop-loss and take-profit levels.
- Combine the indicator with other tools (e.g., trendlines, moving averages) for a more comprehensive trading strategy.
Notes:
- The indicator works on all timeframes, but the appearance of FVGs and swings will vary depending on the chart's timeframe.
- For best results, use the indicator on a clean chart to avoid visual clutter, especially if you increase the fvgLimit.
- The swing high/low lines are drawn with 50% opacity to ensure they don’t overpower other chart elements, but they are still clearly visible.
Author’s Note:
This script was developed to help traders identify key price levels with ease. I hope it adds value to your trading! If you have any feedback or suggestions for improvement, feel free to leave a comment. Happy trading!
BB-BO.ELF Signals by ElfAlgorithmsBO.ELF Trading Signals By ElfAlgorithms
📌 English
The BB-Trend-Signals By ElfAlgorithms is a powerful Bollinger Bands-based indicator designed to detect strong price movements and trend continuation signals.
🔹 Key Features:
✅ Detects price touches on the upper and lower Bollinger Bands.
✅ Confirms trends by checking the last five closing candles relative to the middle band.
✅ Filters out false signals by requiring price closures in specific Bollinger zones.
✅ Identifies trend strength by counting consecutive candle closes above/below critical levels.
✅ Provides real-time alerts for trading opportunities.
This indicator is ideal for traders who rely on Bollinger Bands to identify breakout trends and potential reversals. Whether you are a day trader or swing trader, BO.ELF Trading Signals helps you make informed decisions! 🚀

Custom 6H Candle HighlightHighlights a certain 6H candle on the chart. Input which 6H Candle in the settings for the indicator.

Lance Breitstein AI-Trend Momentum SwiftEdgeThis indicator is inspired by Lance Breitstein's trend-following strategy, emphasizing trading in the direction of momentum while avoiding counter-trend setups. It uses hidden Exponential Moving Average (EMA) and Volume Weighted Average Price (VWAP) to determine trend direction on the current timeframe. Signals are generated based on price breakouts and momentum, aligned with multi-timeframe analysis (1H, 4H, Daily) to enhance trade confirmation.
Key Features:
Visualizes trading signals as vertical "laser beams" (green for long, fuchsia for short) when conditions align.
Displays "Long OK" or "Short OK" labels below signals when the current trend matches at least one higher timeframe.
Includes a futuristic dashboard showing trend direction across 1H, 4H, and Daily timeframes.
Designed for simplicity and clarity, reflecting Breitstein's focus on immediate momentum within a defined trend.
How to Use:
Apply the indicator to your chart (works on any timeframe, though lower timeframes like 1M or 5M align with day trading).
Look for green laser beams with "Long OK" labels to consider long entries, indicating price is above EMA and VWAP, with momentum and higher timeframe support.
Look for fuchsia laser beams with "Short OK" labels for short entries, indicating price is below EMA and VWAP, with momentum and higher timeframe support.
Use the dashboard to assess trend alignment across 1H, 4H, and Daily (▲ for up, ▼ for down, — for neutral).
Avoid trading when no signals appear, as this suggests consolidation or lack of momentum.
Notes:
Customize input parameters (EMA period, momentum period, etc.) to suit your trading style.
This indicator does not guarantee profits and should be used with proper risk management and market analysis.
Inspired by Lance Breitstein's philosophy: "Trade with the trend, let winners run, and cut losers quickly."

Volume Patterns [SS]Hey everyone,
Been a while since doing anything with Pinescript.
Here is my iteration of a Volume Pattern identification, inspired by Bulkowski's work on patterns and volume.
The indicator aims to identify the 4 major types of volume patterns, these are:
Bullish Breakout Volume
Bearish Breakout Volume
Inverted Domes
Domes
Classification
These patterns are all assigned to a classification based on theory. For example, dome volume is usually bearish, inverted dome is usually bullish, etc. etc. However, in order to accommodate changing sentiments and volatility, I have coded logic into the indicator to assess for the actual sentiment associated with these patterns itself.
The indicator calculates the average return associated with each pattern, scaling the data into a percent return. It then has the ability to re-scale the target using the close price associated with the pattern at the time of pattern signaling, to calculate the target price and plot the target on the chart for you.
Additionally, it provides you with the following:
Labels to signal when a pattern has happened
A table that shows you the average returns associated with the 4 major patterns
Target lines with labels that visually show you the target price associated with the pattern, as well as which pattern they are associated with.
All of these things can be toggled on or off depending on your preference.
Customizing the indicator
In addition to being able to toggle the visuals on or off depending on what you want to see or not see, there are some minor customization abilities in terms of training the indicator to recognize the patterns and predict the TP.
The first one is the Training length
In the settings, you will see "Train", and the default is 500. This is the amount the indicator is looking back in history to learn the patterns and returns associated with them. This 500 is appropriate in most cases and on most timeframes.
Lastly, the Lookforward Length
The look forward length represents the number of bars forward you want to determine the returns for. It is defaulted to 10, but you can modify it.
So, if you are on the 1-Minute chart and have the look forward set to 10, then once a signal happens, the target price is calculated based on 10 minutes from the time of signal. You can increase this or decrease this based on your preference.
Longer look forwards can be good for swingers but should be used on the larger timeframes, shorter are good for scalpers but should be used on the shorter timeframes.
The indicator's use is incredibly simple, you'll pick it up in no time!
Hope you enjoy it and as always, safe trades!
Just an FYI for those who may have questions:
The indicator is open source. This means you are free to take it and modify it as you wish. You do not need to ask me.
Please read the description carefully, as 100% of questions I am asked about indicators are covered in the description. ;-)
Have a good one guys and gals! 🚀🚀🚀

SMC + SMT DivergenceMost code taken from LuxAlgo
The SMC & SMT Divergences indicator is a powerful tool designed for traders utilizing Smart Money Concepts (SMC) and ICT (Inner Circle Trader) methodologies. It identifies key market structure shifts such as Break of Structure (BOS) and Change of Character (CHoCH), helping traders spot trend reversals and continuations. The indicator also highlights order blocks (OBs), fair value gaps (FVGs), and liquidity zones like equal highs and lows, which are critical areas for institutional trading activity. Additionally, it incorporates SMT (Smart Money Tool) divergences, allowing traders to detect intermarket discrepancies between correlated assets, further refining trade entries and exits. With its ability to visualize institutional footprints and key price levels, this indicator is an essential tool for traders seeking to align their strategies with smart money movements.

ADX Green Trend, Red ChopBased on the ADX indicator. This uses the calculated slope of the ADX line to show if momentum is increasing or decreasing. Green means the slope of the ADX is positive and the trend in increasing. Red means the ADX slope is positive and momentum is decreasing.Gray or Yellow is aneutral transitional zone

Day Trading Trend & Candle Predictor with AIThe table first entry is the actual accuracy of the algorithm. Second one is the trend continuation %. Second row shows the next 1 and 2 candles %.
The arrow shows the most probable continuation for the chart.
Works on any timeframe,
Try it out and let me know what you think!

Sharpe Ratio Indicator (365)Sharpe Ratio Indicator (365)
Inspired by: www.tradingview.com
&
cryptoquant.com
Meant to be used on the 1D chart and on BTC.
The Sharpe Ratio Indicator (365 days) is a tool for evaluating risk-adjusted returns, designed for investors who want to assess whether BTC is overvalued, undervalued, or in a neutral state. It plots the Sharpe Ratio over the past 180 days, color-coded to indicate valuation states:
- Red: Overvalued (Sharpe Ratio > 2.9).
- Green: Undervalued (Sharpe Ratio < -0.1).
-Blue: Critically Undervalued (Sharpe Ratio <-1.5).
- Yellow: Neutral (between -0.1 and 2.9).
Note that you can change those values yourself in the settings of the indicator.
Strengths:
- Real-time feedback on risk-adjusted returns helps in making timely investment decisions.
- Color-coded signals (red, green, blue and yellow) provide an intuitive, visual indication of the asset's valuation.
- Flexible: Easily adjustable to different subjective valuation levels and risk-free rates.

Machine Learning & Breaktout
study(title = "Volume Flow Indicator ", shorttitle="VFI_LB")
length = input(130, title="VFI length")
coef = input(0.2)
vcoef = input(2.5, title="Max. vol. cutoff")
signalLength=input(5)
smoothVFI=input(false, type=bool)
ma(x,y) => smoothVFI ? sma(x,y) : x
typical=hlc3
inter = log( typical ) - log( typical )
vinter = stdev(inter, 30 )
cutoff = coef * vinter * close
vave = sma( volume, length )
vmax = vave * vcoef
vc = iff(volume < vmax, volume, vmax) //min( volume, vmax )
mf = typical - typical
vcp = iff( mf > cutoff, vc, iff ( mf < -cutoff, -vc, 0 ) )
vfi = ma(sum( vcp , length )/vave, 3)
vfima=ema( vfi, signalLength )
d=vfi-vfima
plot(0, color=gray, style=3)
showHisto=input(false, type=bool)
plot(showHisto ? d : na, style=histogram, color=gray, linewidth=3, transp=50)
plot( vfima , title="EMA of vfi", color=orange)
plot( vfi, title="vfi", color=green,linewidth=2)

IU Bigger than range strategyDESCRIPTION
IU Bigger Than Range Strategy is designed to capture breakout opportunities by identifying candles that are significantly larger than the previous range. It dynamically calculates the high and low of the last N candles and enters trades when the current candle's range exceeds the previous range. The strategy includes multiple stop-loss methods (Previous High/Low, ATR, Swing High/Low) and automatically manages take-profit and stop-loss levels based on user-defined risk-to-reward ratios. This versatile strategy is optimized for higher timeframes and assets like BTC but can be fine-tuned for different instruments and intervals.
USER INPUTS:
Look back Length: Number of candles to calculate the high-low range. Default is 22.
Risk to Reward: Sets the target reward relative to the stop-loss distance. Default is 3.
Stop Loss Method: Choose between:(Default is "Previous High/Low")
- Previous High/Low
- ATR (Average True Range)
- Swing High/Low
ATR Length: Defines the length for ATR calculation (only applicable when ATR is selected as the stop-loss method) (Default is 14).
ATR Factor: Multiplier applied to the ATR to determine stop-loss distance(Default is 2).
Swing High/Low Length: Specifies the length for identifying swing points (only applicable when Swing High/Low is selected as the stop-loss method).(Default is 2)
LONG CONDITION:
The current candle’s range (absolute difference between open and close) is greater than the previous range.
The closing price is higher than the opening price (bullish candle).
SHORT CONDITIONS:
The current candle’s range exceeds the previous range.
The closing price is lower than the opening price (bearish candle).
LONG EXIT:
Stop-loss:
- Previous Low
- ATR-based trailing stop
- Recent Swing Low
Take-profit:
- Defined by the Risk-to-Reward ratio (default 3x the stop-loss distance).
SHORT EXIT:
Stop-loss:
- Previous High
- ATR-based trailing stop
- Recent Swing High
Take-profit:
- Defined by the Risk-to-Reward ratio (default 3x the stop-loss distance).
ALERTS:
Long Entry Triggered
Short Entry Triggered
WHY IT IS UNIQUE:
This strategy dynamically adapts to different market conditions by identifying candles that exceed the previous range, ensuring that it only enters trades during strong breakout scenarios.
Multiple stop-loss methods provide flexibility for different trading styles and risk profiles.
The visual representation of stop-loss and take-profit levels with color-coded plots improves trade monitoring and decision-making.
HOW USERS CAN BENEFIT FROM IT:
Ideal for breakout traders looking to capitalize on momentum-driven price moves.
Provides flexibility to customize stop-loss methods and fine-tune risk management parameters.
Helps minimize drawdowns with a strong risk-to-reward framework while maximizing profit potential.

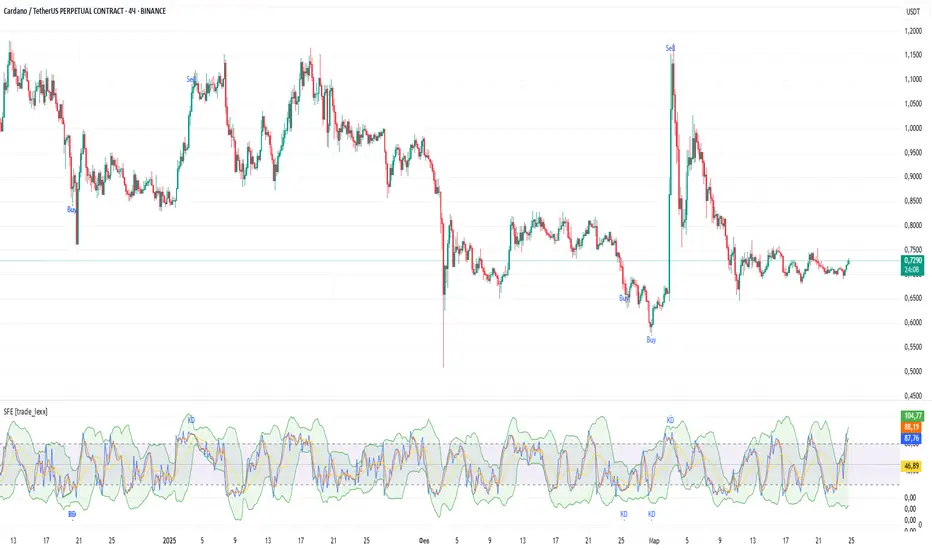
Stochastic Fusion Elite [trade_lexx]📈 Stochastic Fusion Elite is your reliable trading assistant!
📊 What is Stochastic Fusion Elite ?
Stochastic Fusion Elite is a trading indicator based on a stochastic oscillator. It analyzes the rate of price change and generates buy or sell signals based on various technical analysis methods.
💡 The main components of the indicator
📊 Stochastic oscillator (K and D)
Stochastic shows the position of the current price relative to the price range for a certain period. Values above 80 indicate overbought (an early sale is possible), and values below 20 indicate oversold (an early purchase is possible).
📈 Moving Averages (MA)
The indicator uses 10 different types of moving averages to smooth stochastic lines.:
- SMA: Simple moving average
- EMA: Exponential moving average
- WMA: Weighted moving average
- HMA: Moving Average Scale
- KAMA: Kaufman Adaptive Moving Average
- VWMA: Volume-weighted moving average
- ALMA: Arnaud Legoux Moving Average
- TEMA: Triple exponential moving average
- ZLEMA: zero delay exponential moving average
- DEMA: Double exponential moving average
The choice of the type of moving average affects the speed of the indicator's response to market changes.
🎯 Bollinger Bands (BB)
Bands around the moving average that widen and narrow depending on volatility. They help determine when the stochastic is out of the normal range.
🔄 Divergences
Divergences show discrepancies between price and stochastic:
- Bullish divergence: price is falling and stochastic is rising — an upward reversal is possible
- Bearish divergence: the price is rising, and stochastic is falling — a downward reversal is possible
🔍 Indicator signals
1️⃣ KD signals (K and D stochastic lines)
- Buy signal:
- What happens: the %K line crosses the %D line from bottom to top
- What does it look like: a green triangle with the label "KD" under the chart and the label "Buy" below the bar
- What does this mean: the price is gaining an upward momentum, growth is possible
- Sell signal:
- What happens: the %K line crosses the %D line from top to bottom
- What it looks like: a red triangle with the label "KD" above the chart and the label "Sell" above the bar
- What does this mean: the price is losing its upward momentum, possibly falling
2️⃣ Moving Average Signals (MA)
- Buy Signal:
- What happens: stochastic crosses the moving average from bottom to top
- What it looks like: a green triangle with the label "MA" under the chart and the label "Buy" below the bar
- What does this mean: stochastic is starting to accelerate upward, price growth is possible
- Sell signal:
- What happens: stochastic crosses the moving average from top to bottom
- What it looks like: a red triangle with the label "MA" above the chart and the label "Sell" above the bar
- What does this mean: stochastic is starting to accelerate downwards, a price drop is possible
3️⃣ Bollinger Band Signals (BB)
- Buy signal:
- What happens: stochastic crosses the lower Bollinger band from bottom to top
- What it looks like: a green triangle with the label "BB" under the chart and the label "Buy" below the bar
- What does this mean: stochastic was too low and is now starting to recover
- Sell signal:
- What happens: Stochastic crosses the upper Bollinger band from top to bottom
- What it looks like: a red triangle with a "BB" label above the chart and a "Sell" label above the bar
- What does this mean: stochastic was too high and is now starting to decline
4️⃣ Divergence Signals (Div)
- Buy Signal (Bullish Divergence):
- What's happening: the price is falling, and stochastic is forming higher lows
- What it looks like: a green triangle with a "Div" label under the chart and a "Buy" label below the bar
- What does this mean: despite the falling price, the momentum is already changing in an upward direction
- Sell signal (bearish divergence):
- What's going on: the price is rising, and stochastic is forming lower highs
- What it looks like: a red triangle with a "Div" label above the chart and a "Sell" label above the bar
- What does this mean: despite the price increase, the momentum is already weakening
🛠️ Filters to filter out false signals
1️⃣ Minimum distance between the signals
- What it does: sets the minimum number of candles between signals
- Why it is needed: prevents signals from being too frequent during strong market fluctuations
- How to set it up: Set the number from 0 and above (default: 5)
2️⃣ "Waiting for the opposite signal" mode
- What it does: waits for a signal in the opposite direction before generating a new signal
- Why you need it: it helps you not to miss important trend reversals
- How to set up: just turn the function on or off
3️⃣ Filter by stochastic levels
- What it does: generates signals only when the stochastic is in the specified ranges
- Why it is needed: it helps to catch the moments when the market is oversold or overbought
- How to set up:
- For buy signals: set a range for oversold (for example, 1-20)
- For sell signals: set a range for overbought (for example, 80-100)
4️⃣ MFI filter
- What it does: additionally checks the values of the cash flow index (MFI)
- Why it is needed: confirms stochastic signals with cash flow data
- How to set it up:
- For buy signals: set the range for oversold MFI (for example, 1-25)
- For sell signals: set the range for overbought MFI (for example, 75-100)
5️⃣ The RSI filter
- What it does: additionally checks the RSI values to confirm the signals
- Why it is needed: adds additional confirmation from another popular indicator
- How to set up:
- For buy signals: set the range for oversold MFI (for example, 1-30)
- For sell signals: set the range for overbought MFI (for example, 70-100)
🔄 Signal combination modes
1️⃣ Normal mode
- How it works: all signals (KD, MA, BB, Div) work independently of each other
- When to use it: for general market analysis or when learning how to work with the indicator
2️⃣ "AND" Mode ("AND Mode")
- How it works: the alarm appears only when several conditions are triggered simultaneously
- Combination options:
- KD+MA: signals from the KD and moving average lines
- KD+BB: signals from KD lines and Bollinger bands
- KD+Div: signals from the KD and divergence lines
- KD+MA+BB: three signals simultaneously
- KD+MA+Div: three signals at the same time
- KD+BB+Div: three signals at the same time
- KD+MA+BB+Div: all four signals at the same time
- When to use: for more reliable but rare signals
🔌 Connecting to trading strategies
The indicator can be connected to your trading strategies using 6 different channels.:
1. Connector KD signals: connects only the signals from the intersection of lines K and D
2. Connector MA signals: connects only signals from moving averages
3. Connector BB signal: connects only the signals from the Bollinger bands
4. Connector divergence signals: connects only divergence signals
5. Combined Connector: connects any signals
6. Connector for "And" mode: connects only combined signals
🔔 Setting up alerts
The indicator can send alerts when alarms appear.:
- Alerts for KD: when the %K line crosses the %D line
- Alerts for MA: when stochastic crosses the moving average
- Alerts for BB: when stochastic crosses the Bollinger bands
- Divergence alerts: when a divergence is detected
- Combined alerts: for all types of alarms
- Alerts for "And" mode: for combined signals
🎭 What does the indicator look like on the chart ?
- Main lines K and D: blue and orange lines
- Overbought/oversold levels: horizontal lines at levels 20 and 80
- Middle line: dotted line at level 50
- Stochastic Moving Average: yellow line
- Bollinger bands: green lines around the moving average
- Signals: green and red triangles with corresponding labels
📚 How to start using Stochastic Fusion Elite
1️⃣ Initial setup
- Add an indicator to your chart
- Select the types of signals you want to use (KD, MA, BB, Div)
- Adjust the period and smoothing for the K and D lines
2️⃣ Filter settings
- Set the distance between the signals to get rid of unnecessary noise
- Adjust stochastic, MFI and RSI levels depending on the volatility of your asset
- If you need more reliable signals, turn on the "Waiting for the opposite signal" mode.
3️⃣ Operation mode selection
- First, use the standard mode to see all possible signals.
- When you get comfortable, try the "And" mode for rarer signals.
4️⃣ Setting up Alerts
- Select the types of signals you want to be notified about
- Set up alerts for these types of signals
5️⃣ Verification and adaptation
- Check the operation of the indicator on historical data
- Adjust the parameters for a specific asset
- Adapt the settings to your trading style
🌟 Usage examples
For trend trading
- Use the KD and MA signals in the direction of the main trend
- Set the distance between the signals
- Set stricter levels for filters
For trading in a sideways range
- Use BB signals to detect bounces from the range boundaries
- Use a stochastic level filter to confirm overbought/oversold conditions
- Adjust the Bollinger bands according to the width of the range
To determine the pivot points
- Pay attention to the divergence signals
- Set the distance between the signals
- Check the MFI and RSI filters for additional confirmation
ICT Breakers (BOS / MSS - Market Structure) [ICTProTools]The Breakers (Market Structure) indicator is designed to help traders identify true breaker structures , a key concept in Inner Circle Trader (ICT) methodology. In market structure, Breakers represent powerful shifts where a key high or low is broken, leading to a reversal in market direction. Most tools misinterpret structure shifts, using internal structure , leading to fake breakouts. This tool solves that problem by filtering out false signals , providing clear & structured insights , all with multi-timeframe compatibility.
💎 Key Features
⚡️ Breakers in action
The indicator shows the structure following ICT instructions. A breaker is defined by two lines:
The first line confirms the previous trend (it could be interpreted as a BOS).
The second line highlights the moment price breaks structure (with candle body or wick based on your chosen settings), signaling a shift in trend direction (like an MSS).
Furthermore, it’s important to note that a breaker not only shows the structure, but also defines a potential Point of Interest (POI), an area where price may retrace before continuing its trend.
Here, we can observe two clear structure shifts.
On the far left, the market was in a bearish trend, illustrated by the first visible (dotted and red) line. Shortly after, the second (solid and green) line appears, showing a break that initiates a new bullish trend.
This upward movement continues, with the last confirmation marked by a top structure line. And finally, the structure is broken once again indicating a transition back into a bearish trend.
💪 Real Structure with True Highs / Lows
Unlike many indicators that detect internal breakouts , this tool follows ICT’s true market structure rules .
In a bearish trend , a bullish breaker is only confirmed when the high that created the low is broken , and conversely for a bullish scenario.
Fake breakouts are ignored, preventing misleading signals.
In the image above, the white breakout is correctly ignored by the indicator, as it doesn't align with ICT’s structural rules. That white high is simply part of the internal structure, not the true swing point. Instead, the green line highlights the key level that truly matters, the one whose rupture would have confirmed a real change in market structure.
🔔 Smart Alerts for Structure Updates
Stay one step ahead with customizable alerts designed to notify you instantly when market structure changes occur.
Get notified for BOS (Continuation) and / or MSS (Breaker) events.
Set alerts for bullish , bearish , or both directions.
Choose between once or repeated alerts , based on your strategy.
This feature allows traders to remain focused and reactive , even when monitoring multiple markets.
In the alert settings, select which structure shifts you want to be notified of. Whether you're a scalper or a swing trader, the alerts keep you connected to key moments without needing to constantly monitor the chart.
⏳ Multi-Timeframe Structure
All features of the indicator are fully compatible with higher timeframes .
Get a broader view of market structure without switching timeframes.
Monitor higher timeframe structures and receive alerts, all without leaving your analysis chart .
In this example, the market structure of the 30m timeframe is displayed while on a 5m chart, providing a clearer perspective.
✨ Customization & User Control
Make it yours! The indicator allows full customization:
Swing bars (to confirm high / low)
Select your mode for Breakers (MSS) , using the candle body only or body / wick
Line style (type, width, color)
Choice of displayed timeframe
Activate any alert , with the frequency you want
🎯 Conclusion
✅ Avoid false signals by focusing on true ICT Breakers
✅ Smart alerts to never miss a structural shift
✅ Multi-timeframe support for enhanced analysis
✅ Clean & professional design for an optimal trading experience

Bim EMA 35 NavigatorBim EMA 35 Navigator
The Bim EMA 35 Navigator is a powerful trend-following and pullback-based trading indicator designed to help traders identify key buy and sell opportunities using the Exponential Moving Average (EMA 35).
Key Features:
✅ EMA 35 Trend Detection – The EMA line changes color: Green for an uptrend and Red for a downtrend.
✅ Buy & Sell Alerts – Generates alerts when price crosses above or below the EMA 35.
✅ Pullback Detection – Identifies pullbacks to the EMA within a trend, providing additional trade opportunities.
✅ Customizable Parameters – Users can fine-tune pullback thresholds and confirmation candles.
How It Works:
Trend Confirmation: The EMA 35 helps determine whether the market is in an uptrend or downtrend.
Entry Signals: A buy signal appears when price crosses above the EMA in an uptrend, and a sell signal appears when price crosses below the EMA in a downtrend.
Pullback Opportunities: Detects pullbacks to the EMA and confirms them with recent price action, making it easier to enter trades at better prices.
This indicator is ideal for traders looking to follow trends while also capitalizing on pullback entries. It works well across multiple timeframes and asset classes, including stocks, forex, and crypto.
🚀 Use the Bim EMA 35 Navigator to refine your strategy and improve your trade timing!
