OPEN-SOURCE SCRIPT
High and Low of Last 5 Trading Days
### Indicator Description: High and Low of Last 5 Trading Days
**Indicator Name:** High and Low of Last 5 Trading Days
**Purpose:**
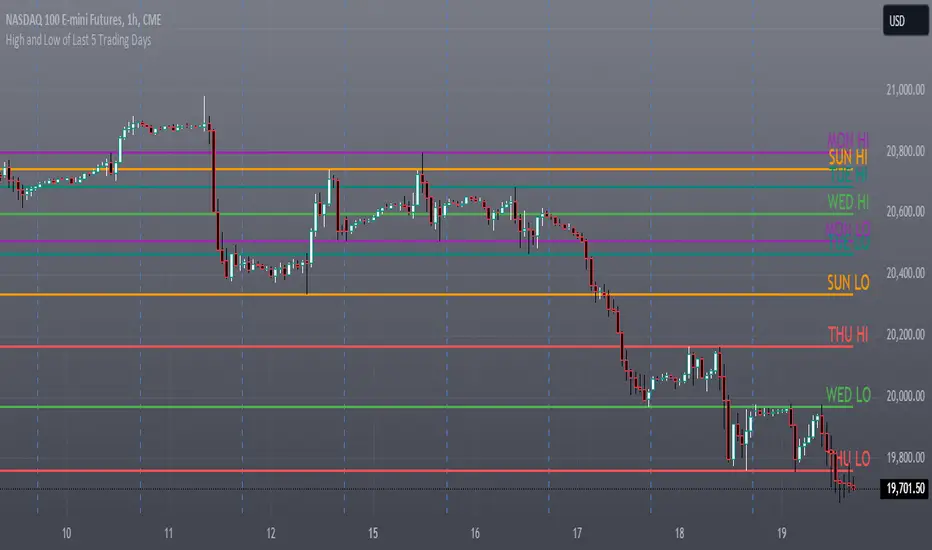
This indicator plots the high and low levels for each of the last 5 trading days on your TradingView chart. It helps traders to visualize important price levels from the recent trading history, which can act as potential support and resistance levels.
**Features:**
1. **Daily High and Low Levels:** Plots the high and low prices for each of the last 5 trading days.
2. **Unique Colors for Each Day:** Each trading day's high and low levels are color-coded uniquely for easy identification.
3. **Solid Lines:** The high and low levels are represented by solid lines for better visibility.
4. **Day Labels:** The lines are labeled with the corresponding day and whether it is a high or low level (e.g., "MON HI", "MON LO").
5. **Dynamic Updates:** The levels and labels are updated at the beginning of each new day, ensuring that the most recent 5 days are always displayed.
**Usage:**
- **Support and Resistance:** Identify key support and resistance levels based on the previous 5 days' high and low prices.
- **Trend Analysis:** Determine the recent price trend by observing the relative positioning of the daily high and low levels.
- **Price Action:** Analyze price action around these levels to make informed trading decisions.
**Configuration:**
- The indicator does not require any user input. It automatically calculates and displays the high and low levels for the past 5 trading days.
**Visual Elements:**
- **Lines:** Solid lines in different colors (red, green, teal, purple, orange) represent the high and low levels.
- **Labels:** Text labels at the right end of each line indicate the day and whether it is a high or low level (e.g., "MON HI", "TUE LO").
This indicator provides a clear visual representation of significant price levels from the recent trading history, aiding traders in their technical analysis and decision-making process.
**Indicator Name:** High and Low of Last 5 Trading Days
**Purpose:**
This indicator plots the high and low levels for each of the last 5 trading days on your TradingView chart. It helps traders to visualize important price levels from the recent trading history, which can act as potential support and resistance levels.
**Features:**
1. **Daily High and Low Levels:** Plots the high and low prices for each of the last 5 trading days.
2. **Unique Colors for Each Day:** Each trading day's high and low levels are color-coded uniquely for easy identification.
3. **Solid Lines:** The high and low levels are represented by solid lines for better visibility.
4. **Day Labels:** The lines are labeled with the corresponding day and whether it is a high or low level (e.g., "MON HI", "MON LO").
5. **Dynamic Updates:** The levels and labels are updated at the beginning of each new day, ensuring that the most recent 5 days are always displayed.
**Usage:**
- **Support and Resistance:** Identify key support and resistance levels based on the previous 5 days' high and low prices.
- **Trend Analysis:** Determine the recent price trend by observing the relative positioning of the daily high and low levels.
- **Price Action:** Analyze price action around these levels to make informed trading decisions.
**Configuration:**
- The indicator does not require any user input. It automatically calculates and displays the high and low levels for the past 5 trading days.
**Visual Elements:**
- **Lines:** Solid lines in different colors (red, green, teal, purple, orange) represent the high and low levels.
- **Labels:** Text labels at the right end of each line indicate the day and whether it is a high or low level (e.g., "MON HI", "TUE LO").
This indicator provides a clear visual representation of significant price levels from the recent trading history, aiding traders in their technical analysis and decision-making process.
סקריפט קוד פתוח
ברוח האמיתית של TradingView, יוצר הסקריפט הזה הפך אותו לקוד פתוח, כך שסוחרים יוכלו לעיין בו ולאמת את פעולתו. כל הכבוד למחבר! אמנם ניתן להשתמש בו בחינם, אך זכור כי פרסום חוזר של הקוד כפוף ל־כללי הבית שלנו.
כתב ויתור
המידע והפרסומים אינם מיועדים להיות, ואינם מהווים, ייעוץ או המלצה פיננסית, השקעתית, מסחרית או מכל סוג אחר המסופקת או מאושרת על ידי TradingView. קרא עוד ב־תנאי השימוש.