OPEN-SOURCE SCRIPT
Fractal Dimension
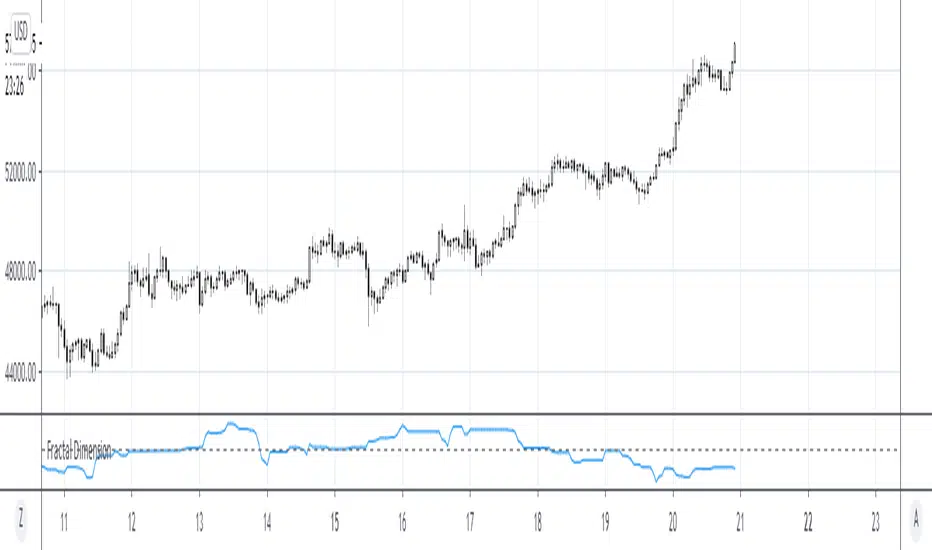
John F Ehlers' Fractal Dimension
Description:
Fractal Dimension is a measure of how complicated a self similar shape is. For instance, a line is smaller and more basic than a square.
The lower the Fractal Dimension the closer a stock chart is to a straight line and therefore the stronger the trend. High readings on the other hand reveal a complex fractal; the shape of a range bound market.
These two different market types require very different strategies in order to maximize profits and minimize losses.
סקריפט קוד פתוח
ברוח האמיתית של TradingView, יוצר הסקריפט הזה הפך אותו לקוד פתוח, כך שסוחרים יוכלו לעיין בו ולאמת את פעולתו. כל הכבוד למחבר! אמנם ניתן להשתמש בו בחינם, אך זכור כי פרסום חוזר של הקוד כפוף ל־כללי הבית שלנו.
כתב ויתור
המידע והפרסומים אינם מיועדים להיות, ואינם מהווים, ייעוץ או המלצה פיננסית, השקעתית, מסחרית או מכל סוג אחר המסופקת או מאושרת על ידי TradingView. קרא עוד ב־תנאי השימוש.