OPEN-SOURCE SCRIPT
Distance Bands Oscillator_KT
█ OVERVIEW
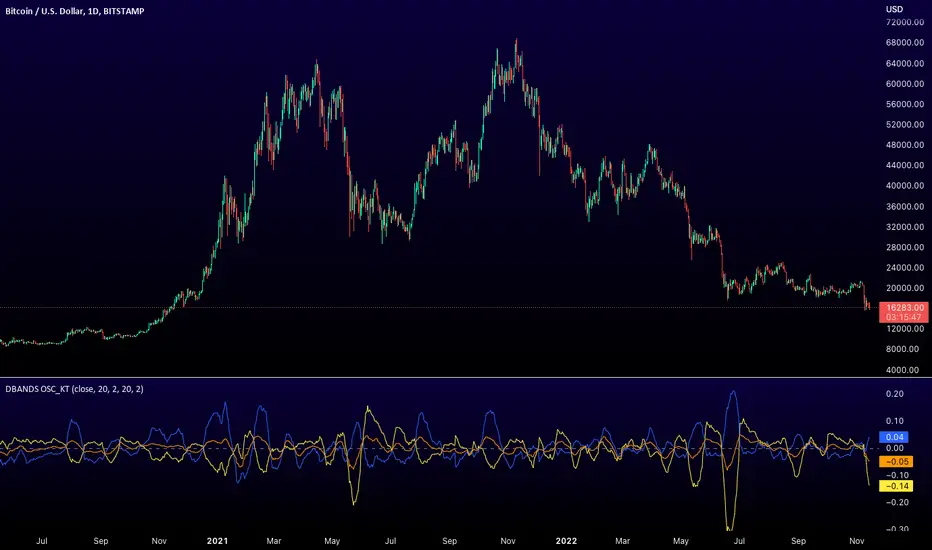
This tool is based on both Bollinger Bands and Keltner Channels, and measures 3 distances between the two, respectively.
Similar to the Band Width indicator, this can be used as a measure of volatility, and can be used to measure uptrend, downtrend and chop regions on a given chart.
Happy Trading,
ET
This tool is based on both Bollinger Bands and Keltner Channels, and measures 3 distances between the two, respectively.
- Upper Kelt to Upper Bollinger Band
- Lower Kelt to Lower Bollinger Band
- Kelt Basis to Bollinger Basis Basis
Similar to the Band Width indicator, this can be used as a measure of volatility, and can be used to measure uptrend, downtrend and chop regions on a given chart.
Happy Trading,
ET
סקריפט קוד פתוח
ברוח האמיתית של TradingView, יוצר הסקריפט הזה הפך אותו לקוד פתוח, כך שסוחרים יוכלו לעיין בו ולאמת את פעולתו. כל הכבוד למחבר! אמנם ניתן להשתמש בו בחינם, אך זכור כי פרסום חוזר של הקוד כפוף ל־כללי הבית שלנו.
Eric Thies
כתב ויתור
המידע והפרסומים אינם מיועדים להיות, ואינם מהווים, ייעוץ או המלצה פיננסית, השקעתית, מסחרית או מכל סוג אחר המסופקת או מאושרת על ידי TradingView. קרא עוד ב־תנאי השימוש.