OPEN-SOURCE SCRIPT
Hinton Map
█ HINTON MAP
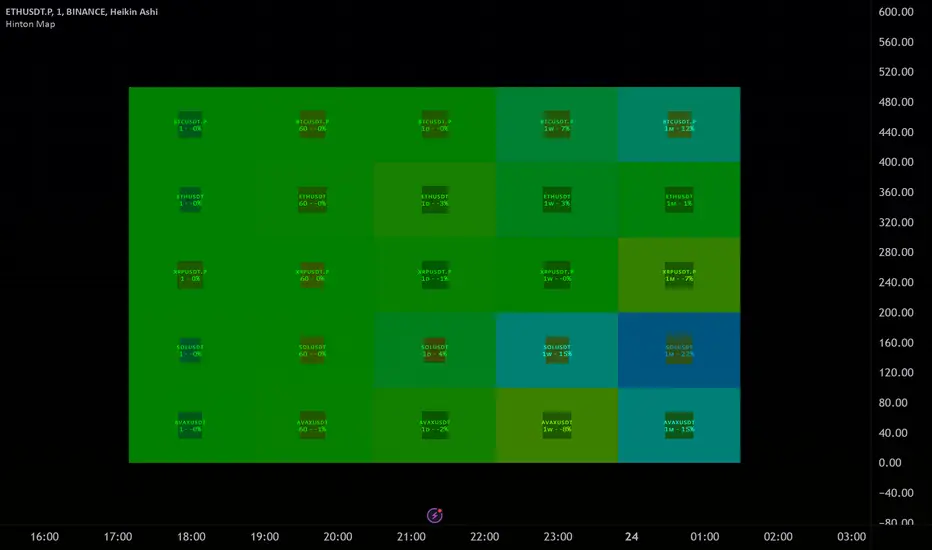
This script displays a Hinton Map visualization of market data for user-defined tickers and timeframes. It uses color gradients to represent the magnitude and direction of price change, RSI, and a combination of both.
This is one example. You can modify and try other values as you wish, but do keep the incoming values between -1 and 1.
In the Example Usage:
Users can input up to 5 symbols and 5 timeframes. For each ticker/timeframe combination:
Inputs:
•Unit Size (bars):
The size of each Hinton unit in bars.
Type: int
Default Value: 10
•Border Width:
The base width of the inner box border.
Type: int
Default Value: 3
•Negative Hue (0-360):
The hue value for negative price changes (0-360).
Type: float
Default Value: 100
•Positive Hue (0-360):
The hue value for positive price changes (0-360).
Type: float
Default Value: 180
•Ticker 1-5:
The tickers to display on the Hinton map.
Type: string
Default Value: AAPL
•Timeframes (comma separated):
The timeframes to display on the Hinton map (comma-separated).
Type: string
Default Value: 1, 5, 60, 1D, 1W
(Fun Note: My Home town is named `Hinton`)
This script displays a Hinton Map visualization of market data for user-defined tickers and timeframes. It uses color gradients to represent the magnitude and direction of price change, RSI, and a combination of both.
This is one example. You can modify and try other values as you wish, but do keep the incoming values between -1 and 1.
In the Example Usage:
Users can input up to 5 symbols and 5 timeframes. For each ticker/timeframe combination:
- The box size represents the relative magnitude of the 2-bar percentage change.
- The box fill color represents the direction and magnitude of the 2-bar percentage change.
- The box border color and thickness represent the RSI deviation from 50.
- The inner box color represents a combination of price change magnitude and RSI deviation from 50.
- Hovering over each box displays a tooltip with the ticker, timeframe, percentage change, and RSI.
Inputs:
•Unit Size (bars):
The size of each Hinton unit in bars.
Type: int
Default Value: 10
•Border Width:
The base width of the inner box border.
Type: int
Default Value: 3
•Negative Hue (0-360):
The hue value for negative price changes (0-360).
Type: float
Default Value: 100
•Positive Hue (0-360):
The hue value for positive price changes (0-360).
Type: float
Default Value: 180
•Ticker 1-5:
The tickers to display on the Hinton map.
Type: string
Default Value: AAPL
•Timeframes (comma separated):
The timeframes to display on the Hinton map (comma-separated).
Type: string
Default Value: 1, 5, 60, 1D, 1W
(Fun Note: My Home town is named `Hinton`)
סקריפט קוד פתוח
ברוח האמיתית של TradingView, יוצר הסקריפט הזה הפך אותו לקוד פתוח, כך שסוחרים יוכלו לעיין בו ולאמת את פעולתו. כל הכבוד למחבר! אמנם ניתן להשתמש בו בחינם, אך זכור כי פרסום חוזר של הקוד כפוף ל־כללי הבית שלנו.
כתב ויתור
המידע והפרסומים אינם מיועדים להיות, ואינם מהווים, ייעוץ או המלצה פיננסית, השקעתית, מסחרית או מכל סוג אחר המסופקת או מאושרת על ידי TradingView. קרא עוד ב־תנאי השימוש.