OPEN-SOURCE SCRIPT
מעודכן Ice Cream Volume Profile [Visible range]

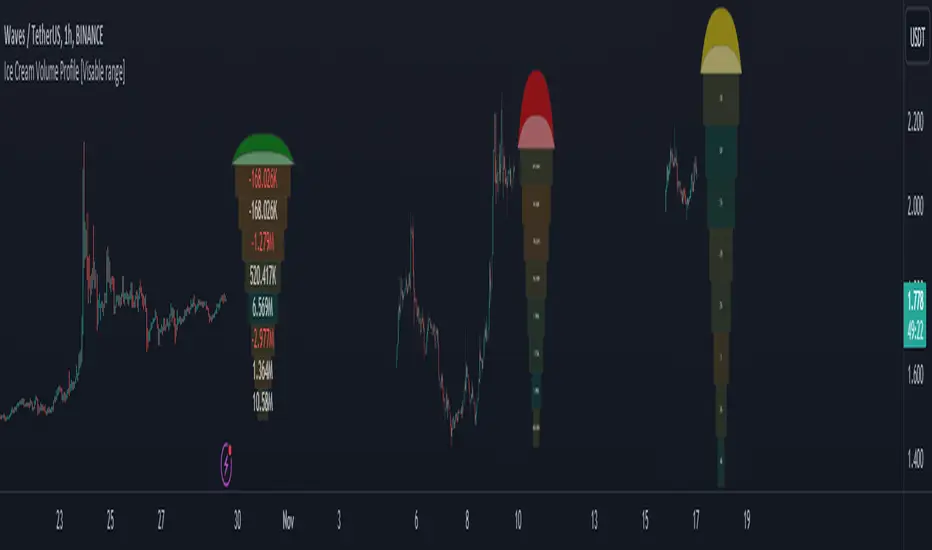
While exploring the new Pine Script feature, Polylines, I've created a fun project called the
Ice Cream Volume Profile for the visible range.
This fun project serves several purposes:
The top part of the ice cream cone changes color as follows:
Polylines are an excellent feature that enables us to create even more intriguing visuals in Pine Script.
Ice Cream Volume Profile for the visible range.
This fun project serves several purposes:
It displays the level at which the most trades (volume) occur.
It provides Delta volume information.
It counts how many times a bar closed within this level.
It assists in drawing support and resistance zones.
It aids in interpreting volume data.
The top part of the ice cream cone changes color as follows:
- Green: When the bullish volume exceeds 55% of the total volume.
- Red: When the bearish volume surpasses 55% of the total volume.
- Yellow: When neither Green nor Red exceeds 55% of the total volume.
Polylines are an excellent feature that enables us to create even more intriguing visuals in Pine Script.
הערות שחרור
Minor name changeסקריפט קוד פתוח
ברוח האמיתית של TradingView, יוצר הסקריפט הזה הפך אותו לקוד פתוח, כך שסוחרים יוכלו לעיין בו ולאמת את פעולתו. כל הכבוד למחבר! אמנם ניתן להשתמש בו בחינם, אך זכור כי פרסום חוזר של הקוד כפוף ל־כללי הבית שלנו.
Links : linktr.ee/tzacks
כתב ויתור
המידע והפרסומים אינם מיועדים להיות, ואינם מהווים, ייעוץ או המלצה פיננסית, השקעתית, מסחרית או מכל סוג אחר המסופקת או מאושרת על ידי TradingView. קרא עוד ב־תנאי השימוש.
סקריפט קוד פתוח
ברוח האמיתית של TradingView, יוצר הסקריפט הזה הפך אותו לקוד פתוח, כך שסוחרים יוכלו לעיין בו ולאמת את פעולתו. כל הכבוד למחבר! אמנם ניתן להשתמש בו בחינם, אך זכור כי פרסום חוזר של הקוד כפוף ל־כללי הבית שלנו.
Links : linktr.ee/tzacks
כתב ויתור
המידע והפרסומים אינם מיועדים להיות, ואינם מהווים, ייעוץ או המלצה פיננסית, השקעתית, מסחרית או מכל סוג אחר המסופקת או מאושרת על ידי TradingView. קרא עוד ב־תנאי השימוש.