OPEN-SOURCE SCRIPT
Variance of OBV
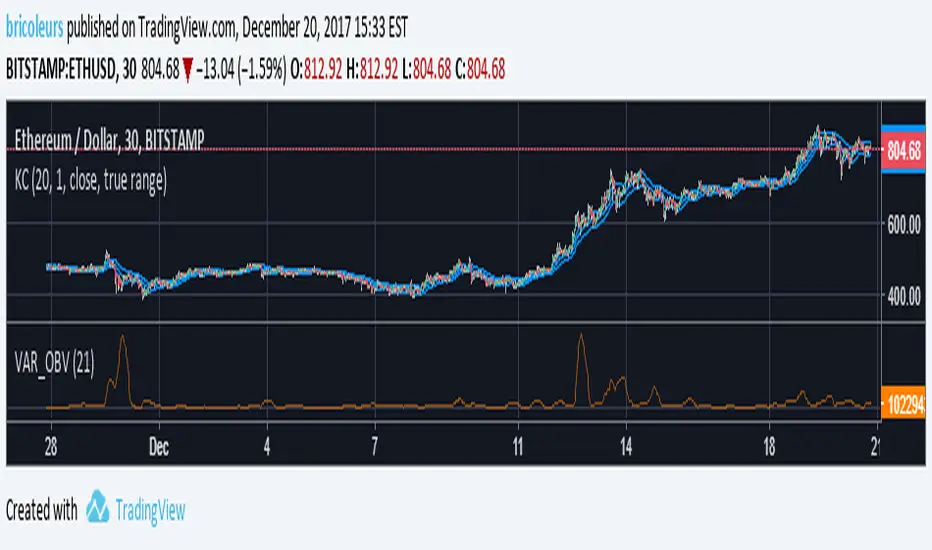
IDEA is to easily spot the length of a calm periods based on OBV.
Some says that after a longer OBV-calm (but not supercalm) period up or down rallies are somewhat more likely)
METHOD: variance of OBV
ADVISE: cannot be used on its own, just with others (RSI, CCI, Coppock, MACD etc.)
Period shall be adjusted to the market.
PERSONAL: I also use it to evaluate how long an uptrend/downtrend is "normal" and when it is a "changer".
Also to see if a market is too flat. (No changes in flat periods is also not a good sign for me)
Also to evaluate magnitude of bursts.
Have fun, use stops, avoid FOMO and comments welcome!
סקריפט קוד פתוח
ברוח האמיתית של TradingView, יוצר הסקריפט הזה הפך אותו לקוד פתוח, כך שסוחרים יוכלו לעיין בו ולאמת את פעולתו. כל הכבוד למחבר! אמנם ניתן להשתמש בו בחינם, אך זכור כי פרסום חוזר של הקוד כפוף ל־כללי הבית שלנו.
כתב ויתור
המידע והפרסומים אינם מיועדים להיות, ואינם מהווים, ייעוץ או המלצה פיננסית, השקעתית, מסחרית או מכל סוג אחר המסופקת או מאושרת על ידי TradingView. קרא עוד ב־תנאי השימוש.