OPEN-SOURCE SCRIPT
מעודכן Volume Profile Array's [fikira]
Inspired by © IldarAkhmetgaleev (AkhIL) - "Poor man's volume profile" - "PMVolProf"
He did a fantastic job on "Volume Profile"!
My script is about making this with array's
Settings:
- period (last x bars) for calculation
- max width (visible horizontal range)
- amount of sections (vertical sections; to many sections can give an error -> lower the sections in that case)
Setting "high/low", "close":
- "high/low"
-> the volume of every bar (in the period) which low is lower than a particular section and which high is higher than that section is added to that section
- "close"
-> here the volume of every bar (in the period) which close closes in the range of a particular section is added to that section
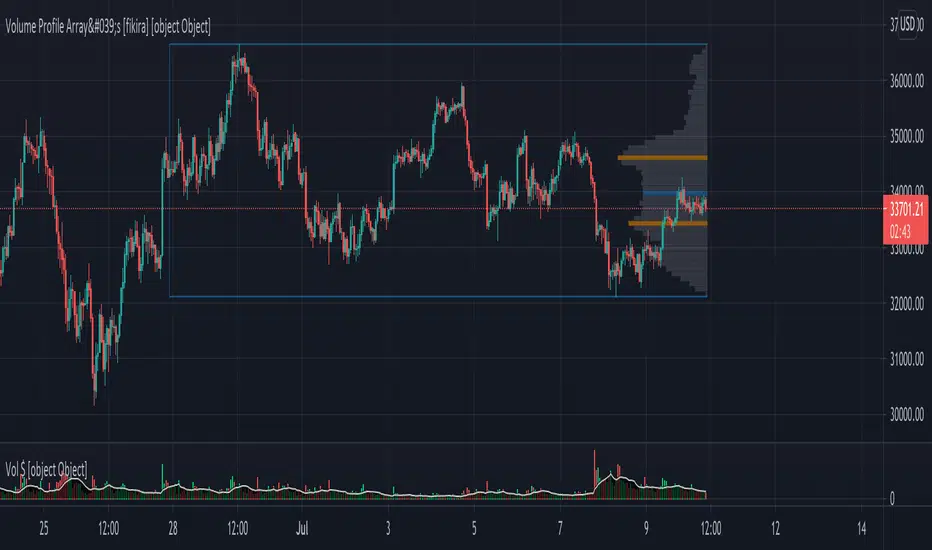
The orange/blue coloured "Volume lines" are the highest/lowest values above and below present close
(can be used as Support/resistance )
"Only show max/min" shows only the orange/blue Volume lines
The period and highest/lowest is show by 2 thin blue lines
Color, line width is adjustable
Cheers!
He did a fantastic job on "Volume Profile"!
My script is about making this with array's
Settings:
- period (last x bars) for calculation
- max width (visible horizontal range)
- amount of sections (vertical sections; to many sections can give an error -> lower the sections in that case)
Setting "high/low", "close":
- "high/low"
-> the volume of every bar (in the period) which low is lower than a particular section and which high is higher than that section is added to that section
- "close"
-> here the volume of every bar (in the period) which close closes in the range of a particular section is added to that section
The orange/blue coloured "Volume lines" are the highest/lowest values above and below present close
(can be used as Support/resistance )
"Only show max/min" shows only the orange/blue Volume lines
The period and highest/lowest is show by 2 thin blue lines
Color, line width is adjustable
Cheers!
הערות שחרור
Changed colour logic:Now you can compare each section with #sections above/below for the max/min
(min 1 and max 5 sections above/below to compare with)
"compare # sections above/below for max/min" = 1:
"compare # sections above/below for max/min" = 3:
"compare # sections above/below for max/min" = 5:
Also added vertical line where the bar calculations start
סקריפט קוד פתוח
ברוח האמיתית של TradingView, יוצר הסקריפט הזה הפך אותו לקוד פתוח, כך שסוחרים יוכלו לעיין בו ולאמת את פעולתו. כל הכבוד למחבר! אמנם ניתן להשתמש בו בחינם, אך זכור כי פרסום חוזר של הקוד כפוף ל־כללי הבית שלנו.
Who are PineCoders?
tradingview.com/chart/SSP/yW5eOqtm-Who-are-PineCoders/
TG Pine Script® Q&A: t.me/PineCodersQA
- We cannot control our emotions,
but we can control our keyboard -
tradingview.com/chart/SSP/yW5eOqtm-Who-are-PineCoders/
TG Pine Script® Q&A: t.me/PineCodersQA
- We cannot control our emotions,
but we can control our keyboard -
כתב ויתור
המידע והפרסומים אינם מיועדים להיות, ואינם מהווים, ייעוץ או המלצה פיננסית, השקעתית, מסחרית או מכל סוג אחר המסופקת או מאושרת על ידי TradingView. קרא עוד ב־תנאי השימוש.