PROTECTED SOURCE SCRIPT
מעודכן Reversals v3
Bullish and bearish reversal generator with future reversals module
הערות שחרור
Includes Future Bearish reversals generated from Highs tooהערות שחרור
Increased options for method to determine turning pointsהערות שחרור
Checks for a cycle count from a previous candle that generated reversalsהערות שחרור
Changed display of cycle predictor to triangles to improve readabilityהערות שחרור
Finalised method of determining turning points and simplified inputs into modelהערות שחרור
Adding titles to analysis:R1br-R4br - bearish reversals 1-4
R1bl-R4bl - bullish reversals 1-4
FR**1-FR**4 - future reversals 1-4
***1R-***4R - recent reversals 1-4
***1E-***4E - elected reversals 1-4
הערות שחרור
Script updated to version 4 which allows tracking of up to 16 bullish and bearish reversals over time including reversal election.PURPOSE:
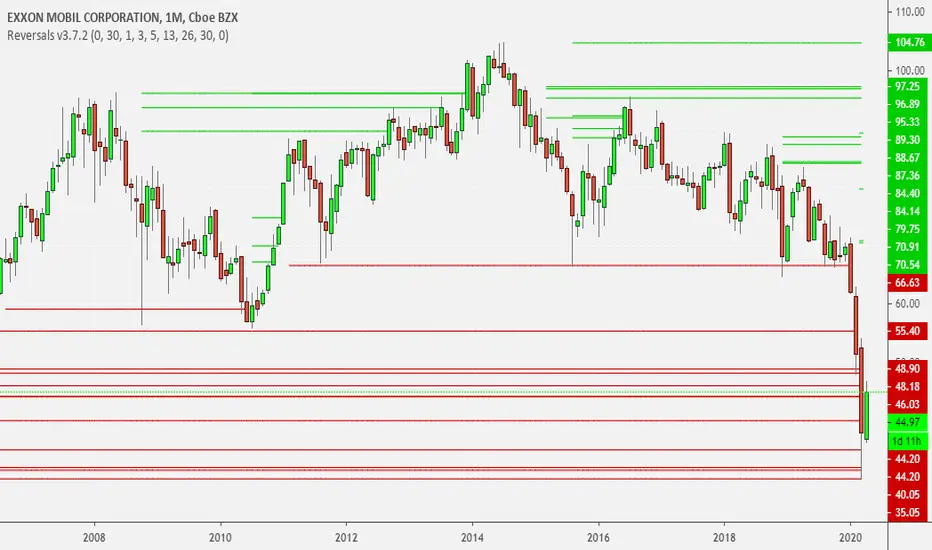
To identify specific key price levels for a market which may be elected based on a closing basis. These price levels indicate continuation or reversal price movements are more or less likely based on the election and non-election of reversals. Further, clusters of reversals provide indications of key support/resistance where a market may take a longer than normal period to continue in a direction or against which the price could reverse
USAGE:
Monitoring continual election of reversals indicate higher probabilities of continuation of the trend. Rejection of key reversals indicate higher probabilities of a trend reversal. Gaps between reversal levels offer opportunities for trades where price can move quickly between reversal levels, especially when heading towards a reversal cluster
INPUTS:
Left bars and Right bars: the number of bars before (Left) and after (Right) to identify a high/low from which reversals are calculated
R1-R4: the lookback reversal periods specific to each market
Minimum / Maximum price: useful for chars with long histories where most of the 16 reversals can be caught at levels well away from the current price level. Providing a minimum and/or maximum focuses on reversals near the current price level.
הערות שחרור
REFER TO PRIOR UPDATE FOR INSTRUCTIONS ON USAGE OF THIS INDICATORUpdate to subversion 3.7.2 to optimise for speed and efficiency with following changes:
- Reduction of number of reversals to 12 bullish and 12 bearish reversals
- Ability to start analysis from a Bar Index later than 0
To see the Bar Index, open the Data Window - the Bar Index for the bar under the mouse cursor will be shown
סקריפט מוגן
סקריפט זה פורסם כמקור סגור. עם זאת, תוכל להשתמש בו בחופשיות וללא כל מגבלות – למד עוד כאן
כתב ויתור
המידע והפרסומים אינם מיועדים להיות, ואינם מהווים, ייעוץ או המלצה פיננסית, השקעתית, מסחרית או מכל סוג אחר המסופקת או מאושרת על ידי TradingView. קרא עוד ב־תנאי השימוש.
סקריפט מוגן
סקריפט זה פורסם כמקור סגור. עם זאת, תוכל להשתמש בו בחופשיות וללא כל מגבלות – למד עוד כאן
כתב ויתור
המידע והפרסומים אינם מיועדים להיות, ואינם מהווים, ייעוץ או המלצה פיננסית, השקעתית, מסחרית או מכל סוג אחר המסופקת או מאושרת על ידי TradingView. קרא עוד ב־תנאי השימוש.