OPEN-SOURCE SCRIPT
מעודכן Relative Performance Table
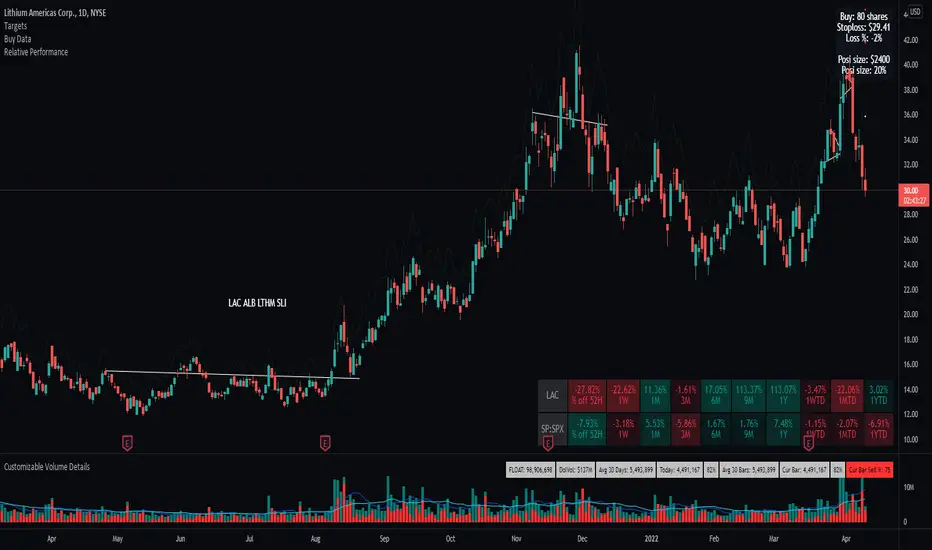
This indicator is based on the Performance section in the TradingView's sidebar and uses new Pine tables functionality, originally coded by @Beeholder. It compares the current price of the symbol to its past price and calculates the rate of return to make it easier to track the performance of the symbol. Note that the Performance sidebar is not updated in real-time, while this indicator is, so on real-time charts the values between the two can differ (the indicator's values are more recent). Made a number of enhancement from Bee's script including relative performance of a selected ticker, dynamic table columns, and other options.
The formula of the calculation is (Current value - Past value) * 100 / Past value, where Past value is:
--Future development will include the ability to transpose the table columns/rows
The formula of the calculation is (Current value - Past value) * 100 / Past value, where Past value is:
- 1W
- 1M
- 3M
- 6M
- 9M
- 52W (1 Year)
- WTD (Week to Date)
- MTD (Month to Date)
- YTD (Year to Date
--Future development will include the ability to transpose the table columns/rows
הערות שחרור
--Minor fix to tooltipהערות שחרור
Added 52 week high calculation to quickly screen whether a ticker is within 25% of the 52 week Highsסקריפט קוד פתוח
ברוח האמיתית של TradingView, יוצר הסקריפט הזה הפך אותו לקוד פתוח, כך שסוחרים יוכלו לעיין בו ולאמת את פעולתו. כל הכבוד למחבר! אמנם ניתן להשתמש בו בחינם, אך זכור כי פרסום חוזר של הקוד כפוף ל־כללי הבית שלנו.
כתב ויתור
המידע והפרסומים אינם מיועדים להיות, ואינם מהווים, ייעוץ או המלצה פיננסית, השקעתית, מסחרית או מכל סוג אחר המסופקת או מאושרת על ידי TradingView. קרא עוד ב־תנאי השימוש.
סקריפט קוד פתוח
ברוח האמיתית של TradingView, יוצר הסקריפט הזה הפך אותו לקוד פתוח, כך שסוחרים יוכלו לעיין בו ולאמת את פעולתו. כל הכבוד למחבר! אמנם ניתן להשתמש בו בחינם, אך זכור כי פרסום חוזר של הקוד כפוף ל־כללי הבית שלנו.
כתב ויתור
המידע והפרסומים אינם מיועדים להיות, ואינם מהווים, ייעוץ או המלצה פיננסית, השקעתית, מסחרית או מכל סוג אחר המסופקת או מאושרת על ידי TradingView. קרא עוד ב־תנאי השימוש.