OPEN-SOURCE SCRIPT
Williams Alligator Trend Filter Heatmap

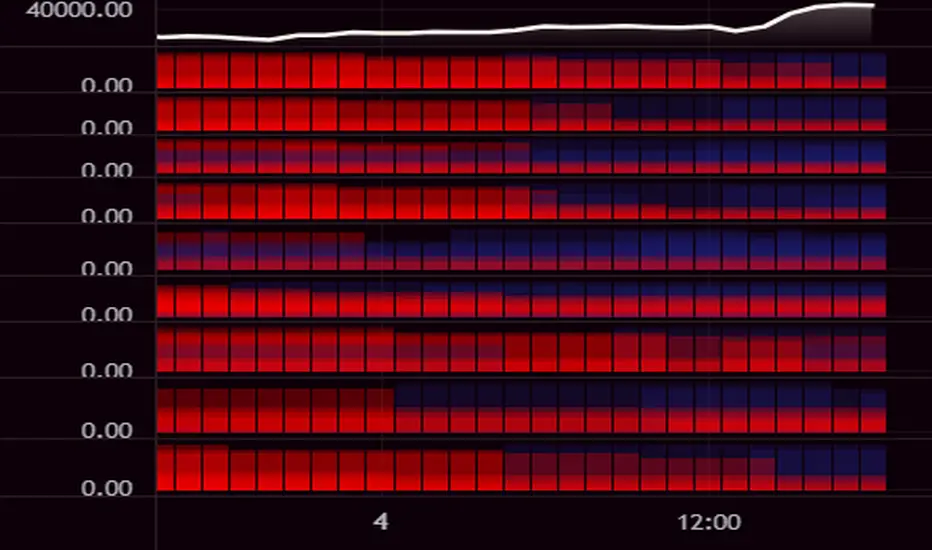
Hello I've decided that the alligator lines can be used to find a trend. This script expands on that and checks 10 different multipliers to see trend over the long term and have 10 values. Those 10 values each give a color to one of the 10 lines in turn giving this Fire like plotting. I personaly use this to see if there is fear (red) in the markets or greed (blue), plotted 9 different crypto coins on the chart and have 4 columns in my setup to see the values on different timeframes. In the chart preview this is 1H,30M,10M,1M to see current environment. The colors use alot of data to generate especialy the bottom part, that colors based on a very long time zone.
סקריפט קוד פתוח
ברוח האמיתית של TradingView, יוצר הסקריפט הזה הפך אותו לקוד פתוח, כך שסוחרים יוכלו לעיין בו ולאמת את פעולתו. כל הכבוד למחבר! אמנם ניתן להשתמש בו בחינם, אך זכור כי פרסום חוזר של הקוד כפוף ל־כללי הבית שלנו.
✅ Let me help you become profitable long-term.
Patreon -> patreon.com/ChartMuse
Patreon -> patreon.com/ChartMuse
✅ Work with me:
Form -> forms.gle/caAJxCNTP4CqjFy4A
Form -> forms.gle/caAJxCNTP4CqjFy4A
Patreon -> patreon.com/ChartMuse
Patreon -> patreon.com/ChartMuse
✅ Work with me:
Form -> forms.gle/caAJxCNTP4CqjFy4A
Form -> forms.gle/caAJxCNTP4CqjFy4A
כתב ויתור
המידע והפרסומים אינם מיועדים להיות, ואינם מהווים, ייעוץ או המלצה פיננסית, השקעתית, מסחרית או מכל סוג אחר המסופקת או מאושרת על ידי TradingView. קרא עוד ב־תנאי השימוש.