OPEN-SOURCE SCRIPT
Net Buying/Selling Flows Toolkit [AlgoAlpha]
🌟📊 Introducing the Net Buying/Selling Flows Toolkit by AlgoAlpha 📈🚀
🔍 Explore the intricate dynamics of market movements with the Net Buying/Selling Flows Toolkit designed for precision and effectiveness in visualizing money inflows and outflows and their impact on asset prices.
[LIST]
*🔀 Multiple Display Modes: Choose from "Flow Comparison", "Net Flow", or "Sum of Flows" to view the data in the most relevant way for your analysis.
*📏 Adjustable Unit Display: Easily manage the magnitude of the values displayed with options like "1 Billion", "1 Million", "1 Thousand", or "None".
*🔧 Lookback Period Customization: Tailor the sum calculation window with a configurable lookback period, applicable in "Sum of Flows" mode.
*📊 Deviation Thresholds: Set up lower and upper deviation thresholds to identify significant changes in flow data.
*🔄 Reversal Signals and Deviation Bands: Enable signals for potential reversals and visualize deviation bands for comparative analysis.
*🎨 Color-coded Visualization: Distinct colors for upward and downward movements make it easy to distinguish between buying and selling pressures.
[/LIST]
🚀 Quick Guide to Using the Net Buying/Selling Flows Toolkit:
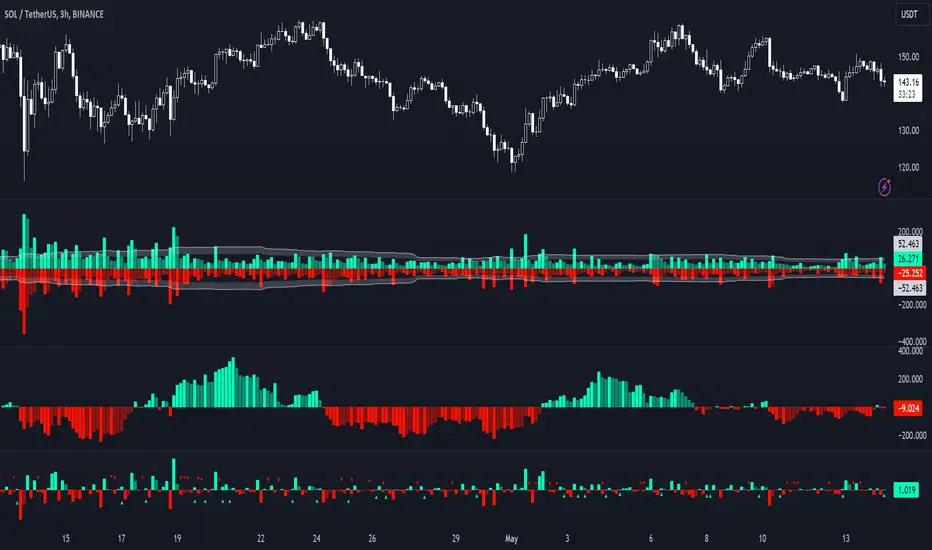
🌐 How It Works:
The toolkit processes volume data on a lower timeframe to distinguish between buying and selling pressures based on intra-bar price closing higher or lower than it opened. It aggregates these transactions and finds the net selling and buying that took place during that bar, offering a clearer view of market fundamentals. The indicator then plots this data visually with multiple modes including comparisons between buying/selling and the net flow of the asset. Deviation thresholds help in identifying significant changes, allowing traders to spot potential buying or selling opportunities based on the money flow dynamics. The "Sum of Flows" mode is unique from other trend following indicators as it does not determine trend based on price action, but rather based on the net buying/selling. Therefore in some cases the "Sum of Flows" mode can be a leading indicator showing bullish/bearish net flows even before the prices move significantly.
Embark on a more informed trading journey with this dynamic and insightful tool, tailor-made for those who demand precision and clarity in their trading strategies. 🌟📉📈
🔍 Explore the intricate dynamics of market movements with the Net Buying/Selling Flows Toolkit designed for precision and effectiveness in visualizing money inflows and outflows and their impact on asset prices.
[LIST]
*🔀 Multiple Display Modes: Choose from "Flow Comparison", "Net Flow", or "Sum of Flows" to view the data in the most relevant way for your analysis.
*📏 Adjustable Unit Display: Easily manage the magnitude of the values displayed with options like "1 Billion", "1 Million", "1 Thousand", or "None".
*🔧 Lookback Period Customization: Tailor the sum calculation window with a configurable lookback period, applicable in "Sum of Flows" mode.
*📊 Deviation Thresholds: Set up lower and upper deviation thresholds to identify significant changes in flow data.
*🔄 Reversal Signals and Deviation Bands: Enable signals for potential reversals and visualize deviation bands for comparative analysis.
*🎨 Color-coded Visualization: Distinct colors for upward and downward movements make it easy to distinguish between buying and selling pressures.
[/LIST]
🚀 Quick Guide to Using the Net Buying/Selling Flows Toolkit:
- 🔍 Add the Indicator: Add the indicator to you favorites. Customize the settings to fit your trading requirements.
- 👁️🗨️ Data Analysis: Compare the trend of Buying and Selling to help indicate whether bulls or bears are in control of the market. Utilize the different display modes to present the data in different form to suite your analysis style.
- 🔔 Set Alerts: Activate alerts for reversal conditions to keep abreast of significant market movements without having to monitor the charts constantly.
🌐 How It Works:
The toolkit processes volume data on a lower timeframe to distinguish between buying and selling pressures based on intra-bar price closing higher or lower than it opened. It aggregates these transactions and finds the net selling and buying that took place during that bar, offering a clearer view of market fundamentals. The indicator then plots this data visually with multiple modes including comparisons between buying/selling and the net flow of the asset. Deviation thresholds help in identifying significant changes, allowing traders to spot potential buying or selling opportunities based on the money flow dynamics. The "Sum of Flows" mode is unique from other trend following indicators as it does not determine trend based on price action, but rather based on the net buying/selling. Therefore in some cases the "Sum of Flows" mode can be a leading indicator showing bullish/bearish net flows even before the prices move significantly.
Embark on a more informed trading journey with this dynamic and insightful tool, tailor-made for those who demand precision and clarity in their trading strategies. 🌟📉📈
סקריפט קוד פתוח
ברוח TradingView אמיתית, מחבר הסקריפט הזה פרסם אותו בקוד פתוח, כך שסוחרים יוכלו להבין ולאמת אותו. כל הכבוד למחבר! אתה יכול להשתמש בו בחינם, אבל השימוש החוזר בקוד זה בפרסום כפוף לכללי הבית. אתה יכול להכניס אותו למועדפים כדי להשתמש בו בגרף.
HALLOWEEN SALE🔽🔽
🔶33% OFF CODE FOR ALL PLANS: 'SPOOKYALPHA' 🔶(ends TODAY 🎃)
🚨Get premium: algoalpha.io
🛜Get FREE signals: discord.gg/xCmqTVRexz
❓Do you have feedback or indicator ideas? Join our server to tell us about it!
🔶33% OFF CODE FOR ALL PLANS: 'SPOOKYALPHA' 🔶(ends TODAY 🎃)
🚨Get premium: algoalpha.io
🛜Get FREE signals: discord.gg/xCmqTVRexz
❓Do you have feedback or indicator ideas? Join our server to tell us about it!
כתב ויתור
המידע והפרסומים אינם אמורים להיות, ואינם מהווים, עצות פיננסיות, השקעות, מסחר או סוגים אחרים של עצות או המלצות שסופקו או מאושרים על ידי TradingView. קרא עוד בתנאים וההגבלות.