OPEN-SOURCE SCRIPT
VolumeVsVSMAComparison
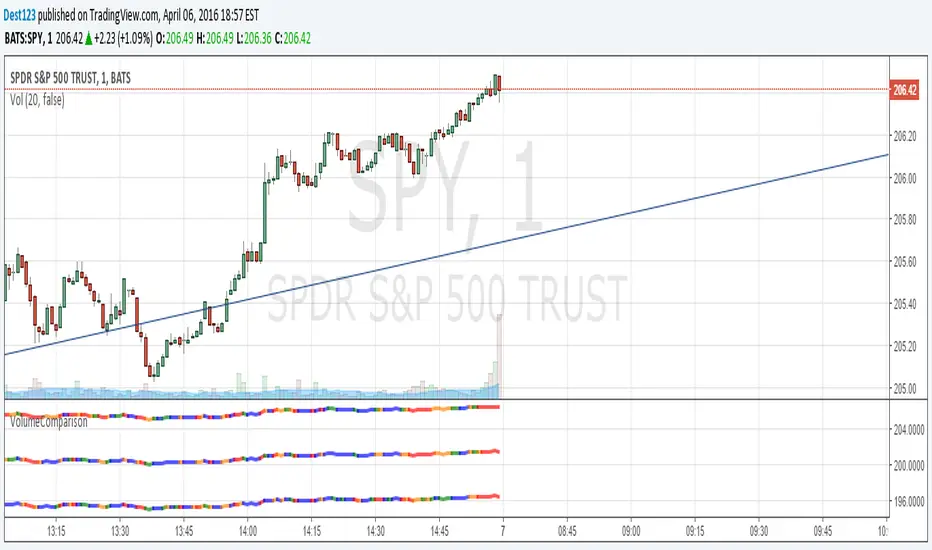
Shows 3 bars. One for the 100sma, one for 25sma, and one for 5sma. The bar color is blue if it's "low volume" compared to the sma, green if it's about average, yellow if it's high, and red if it's very high.
Top bar is 100sma, middle is 25, and bottom is 5
Top bar is 100sma, middle is 25, and bottom is 5
סקריפט קוד פתוח
ברוח האמיתית של TradingView, יוצר הסקריפט הזה הפך אותו לקוד פתוח, כך שסוחרים יוכלו לעיין בו ולאמת את פעולתו. כל הכבוד למחבר! אמנם ניתן להשתמש בו בחינם, אך זכור כי פרסום חוזר של הקוד כפוף ל־כללי הבית שלנו.
כתב ויתור
המידע והפרסומים אינם מיועדים להיות, ואינם מהווים, ייעוץ או המלצה פיננסית, השקעתית, מסחרית או מכל סוג אחר המסופקת או מאושרת על ידי TradingView. קרא עוד ב־תנאי השימוש.