OPEN-SOURCE SCRIPT
מעודכן RSI Candles [cI8DH]

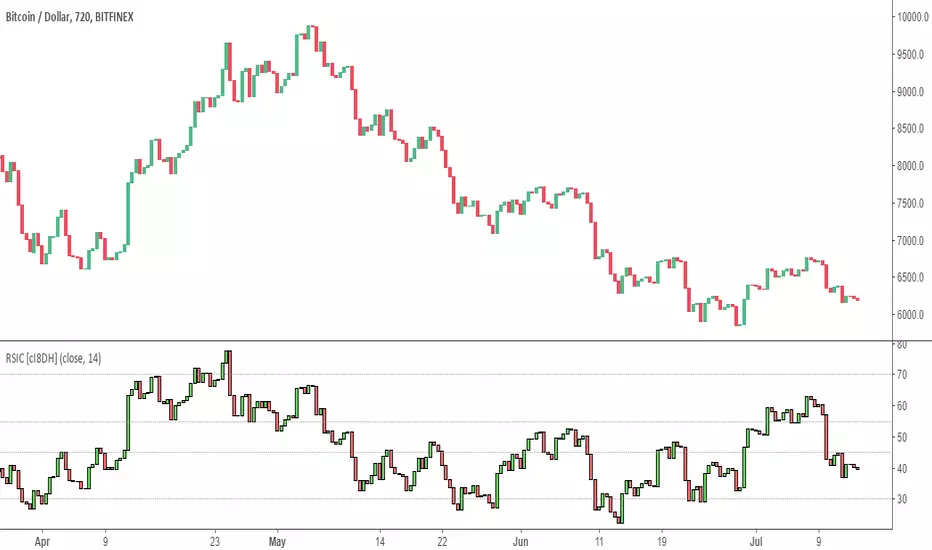
This is candle visualization of regular RSI. That's all.
I have seen two other RSI candles, but their implementation is not correct. The high on RSI usually matches the low on price and vice versa. I have completely turned off the wicks so you can safely use this indicator as a replacement for regular RSI.
I have seen two other RSI candles, but their implementation is not correct. The high on RSI usually matches the low on price and vice versa. I have completely turned off the wicks so you can safely use this indicator as a replacement for regular RSI.
הערות שחרור
- added standard deviation inner band calculation methodהערות שחרור
- minor code optimizationסקריפט קוד פתוח
ברוח האמיתית של TradingView, יוצר הסקריפט הזה הפך אותו לקוד פתוח, כך שסוחרים יוכלו לעיין בו ולאמת את פעולתו. כל הכבוד למחבר! אמנם ניתן להשתמש בו בחינם, אך זכור כי פרסום חוזר של הקוד כפוף ל־כללי הבית שלנו.
כתב ויתור
המידע והפרסומים אינם מיועדים להיות, ואינם מהווים, ייעוץ או המלצה פיננסית, השקעתית, מסחרית או מכל סוג אחר המסופקת או מאושרת על ידי TradingView. קרא עוד ב־תנאי השימוש.
סקריפט קוד פתוח
ברוח האמיתית של TradingView, יוצר הסקריפט הזה הפך אותו לקוד פתוח, כך שסוחרים יוכלו לעיין בו ולאמת את פעולתו. כל הכבוד למחבר! אמנם ניתן להשתמש בו בחינם, אך זכור כי פרסום חוזר של הקוד כפוף ל־כללי הבית שלנו.
כתב ויתור
המידע והפרסומים אינם מיועדים להיות, ואינם מהווים, ייעוץ או המלצה פיננסית, השקעתית, מסחרית או מכל סוג אחר המסופקת או מאושרת על ידי TradingView. קרא עוד ב־תנאי השימוש.
![True Relative Strength Index (True RSI / TRSI) [cI8DH]](https://s3.tradingview.com/k/kfFjkxCa_mid.png)