OPEN-SOURCE SCRIPT
מעודכן Multi ZZ - Support/Resistence

Experimental and probably can be improved further.
Method of deriving support/resistence is as follows:
And that's all we got the full list of support and resistence points.
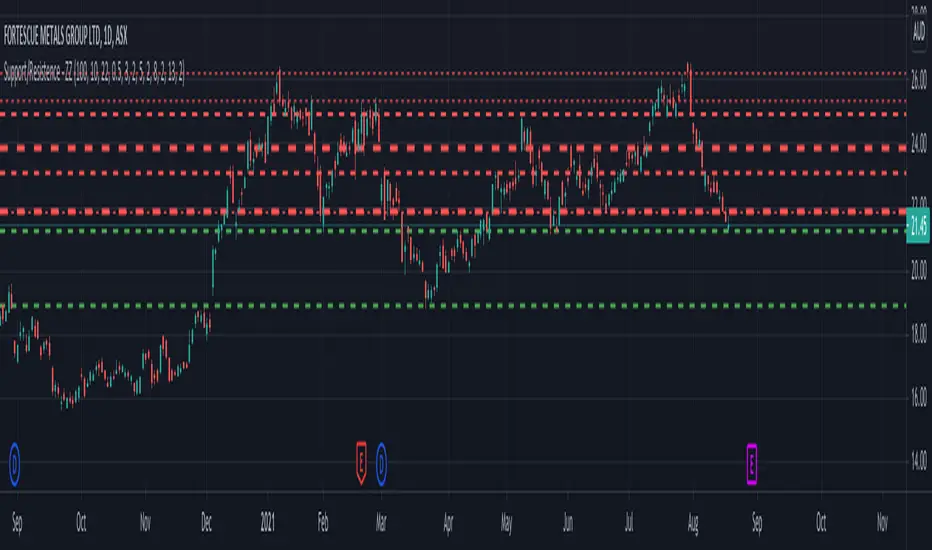
Now, to filter insignificant pivots, chose only those points which has been merged by more than Min Pivots input. Width of the support/resistence lines also will be thicker for the pivots which has more count. Hence thicker line imply strong support and resistence whereas the thinner ones are minor ones.
Method of deriving support/resistence is as follows:
- Calculate Zigzags and start pushing them to SR array as and when they form
- If any of the existing item is within the small distance - merge them. ATR is used to find if the prices are close by.
- Whenever we merge two pivots, strength of support keeps increasing. This means, price has bounced off this point more time. Hence, keep track of number of pivots merged together.
- Keep removing old pivots which are far away based on Loopback input
And that's all we got the full list of support and resistence points.
Now, to filter insignificant pivots, chose only those points which has been merged by more than Min Pivots input. Width of the support/resistence lines also will be thicker for the pivots which has more count. Hence thicker line imply strong support and resistence whereas the thinner ones are minor ones.
הערות שחרור
Convert to Pine 5סקריפט קוד פתוח
ברוח האמיתית של TradingView, יוצר הסקריפט הזה הפך אותו לקוד פתוח, כך שסוחרים יוכלו לעיין בו ולאמת את פעולתו. כל הכבוד למחבר! אמנם ניתן להשתמש בו בחינם, אך זכור כי פרסום חוזר של הקוד כפוף ל־כללי הבית שלנו.
Trial - trendoscope.io/trial
Subscribe - trendoscope.io/pricing
Blog - docs.trendoscope.io
Subscribe - trendoscope.io/pricing
Blog - docs.trendoscope.io
כתב ויתור
המידע והפרסומים אינם מיועדים להיות, ואינם מהווים, ייעוץ או המלצה פיננסית, השקעתית, מסחרית או מכל סוג אחר המסופקת או מאושרת על ידי TradingView. קרא עוד ב־תנאי השימוש.
סקריפט קוד פתוח
ברוח האמיתית של TradingView, יוצר הסקריפט הזה הפך אותו לקוד פתוח, כך שסוחרים יוכלו לעיין בו ולאמת את פעולתו. כל הכבוד למחבר! אמנם ניתן להשתמש בו בחינם, אך זכור כי פרסום חוזר של הקוד כפוף ל־כללי הבית שלנו.
Trial - trendoscope.io/trial
Subscribe - trendoscope.io/pricing
Blog - docs.trendoscope.io
Subscribe - trendoscope.io/pricing
Blog - docs.trendoscope.io
כתב ויתור
המידע והפרסומים אינם מיועדים להיות, ואינם מהווים, ייעוץ או המלצה פיננסית, השקעתית, מסחרית או מכל סוג אחר המסופקת או מאושרת על ידי TradingView. קרא עוד ב־תנאי השימוש.