OPEN-SOURCE SCRIPT
מעודכן RS: Footprint

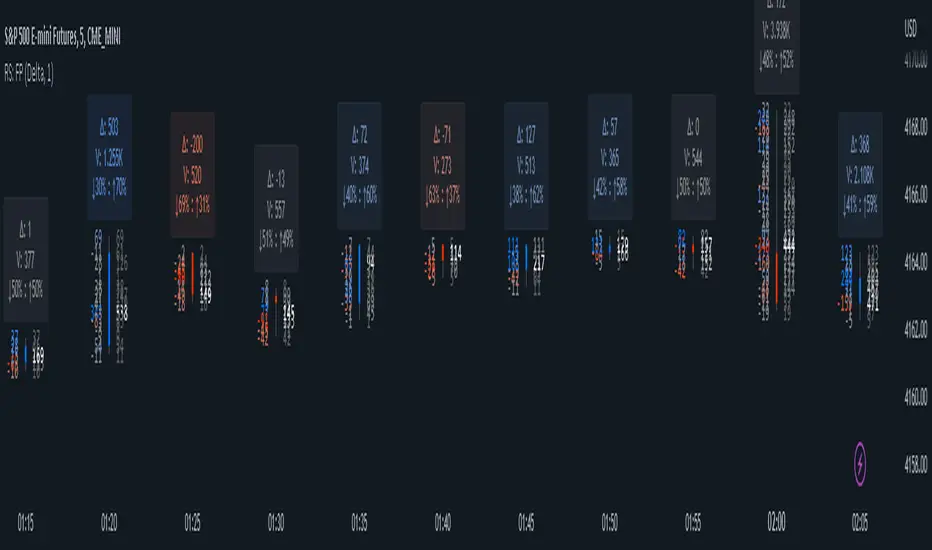
This is live only Footprint indicator.
Warning: TV does not provide tick by tick data and updates come in snapshots. Based on this, this indicator can never show precisely what is happening on the bid/ask. What it shows is only an approximation that works well enough if the tape is not too fast.
Use it at your own risk, with the warning above in mind!
Footprint can be used in two modes:
Zoom in to fit the candles; optionally hide default candles.
Warning: TV does not provide tick by tick data and updates come in snapshots. Based on this, this indicator can never show precisely what is happening on the bid/ask. What it shows is only an approximation that works well enough if the tape is not too fast.
Use it at your own risk, with the warning above in mind!
Footprint can be used in two modes:
- Delta - with bid/ask delta numbers on the left, at the same price level and the total volume numbers on the right
- Bid vs Ask - with the bid on the left and the ask on the right; the coloring is based on the diagonal difference
Zoom in to fit the candles; optionally hide default candles.
הערות שחרור
Minor cleanupהערות שחרור
Namingסקריפט קוד פתוח
ברוח האמיתית של TradingView, יוצר הסקריפט הזה הפך אותו לקוד פתוח, כך שסוחרים יוכלו לעיין בו ולאמת את פעולתו. כל הכבוד למחבר! אמנם ניתן להשתמש בו בחינם, אך זכור כי פרסום חוזר של הקוד כפוף ל־כללי הבית שלנו.
כתב ויתור
המידע והפרסומים אינם מיועדים להיות, ואינם מהווים, ייעוץ או המלצה פיננסית, השקעתית, מסחרית או מכל סוג אחר המסופקת או מאושרת על ידי TradingView. קרא עוד ב־תנאי השימוש.
סקריפט קוד פתוח
ברוח האמיתית של TradingView, יוצר הסקריפט הזה הפך אותו לקוד פתוח, כך שסוחרים יוכלו לעיין בו ולאמת את פעולתו. כל הכבוד למחבר! אמנם ניתן להשתמש בו בחינם, אך זכור כי פרסום חוזר של הקוד כפוף ל־כללי הבית שלנו.
כתב ויתור
המידע והפרסומים אינם מיועדים להיות, ואינם מהווים, ייעוץ או המלצה פיננסית, השקעתית, מסחרית או מכל סוג אחר המסופקת או מאושרת על ידי TradingView. קרא עוד ב־תנאי השימוש.