OPEN-SOURCE SCRIPT
מעודכן Bollinger Bands w/ Squeeze Alert

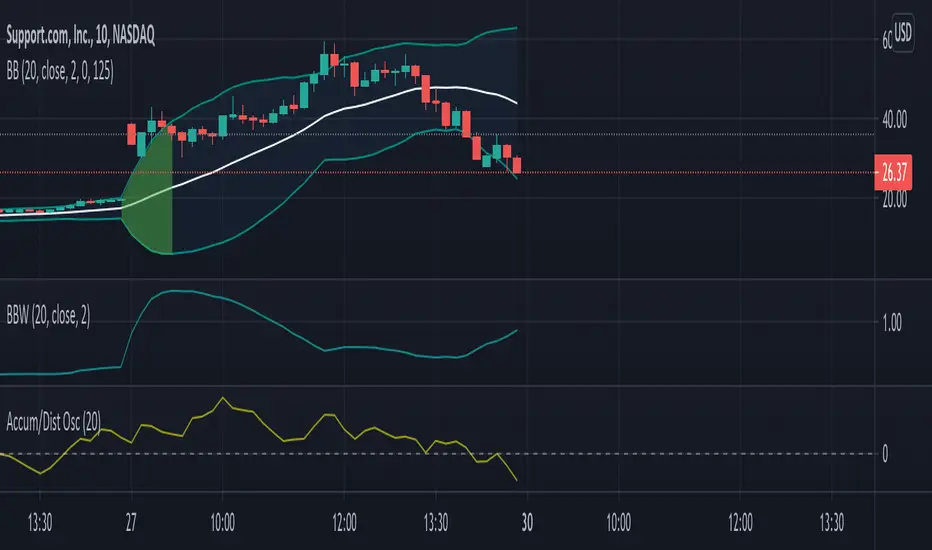
Bollinger's "simple" explanation for a Squeeze is the lowest volatility in the last 6 months. This indicator uses a default look-back period of 125 bars to determine the lowest BandWidth. When current BandWidth drops below the lowest BandWidth of the look-back period, the background of the bands turns red. Default look-back of 125 bars is ~6 months on daily charts.
The source, length, and standard deviation for the Bollinger Bands can all be adjusted. The look-back period for the Squeeze indicator can be adjusted as well.
The image shows my Bollinger Bands w/ Squeeze Alert indicator next to someone else's Bollinger Bandwidth w/ Squeeze Alert indicator to demonstrate how it appears on the chart.
הערות שחרור
This version adds the "complicated definition" of The Squeeze as detailed by John Bollinger. "A more complicated definition of The Squeeze that is taught at our seminars involves Bollinger Bands on volatility itself. First plot the 20-day standard deviation of the close, or typical price. Now plot the 125-day, 1.5 standard deviation width Bollinger Bands of the standard deviation just plotted. A Squeeze is triggered when the 20-day standard deviation tags the lower band."
-Bollinger, John; Bollinger, John. Bollinger on Bollinger Bands (p. 194). McGraw-Hill Education.
It also adds an indicator for The Bulge. The Bulge is described as the HIGHEST bandwidth during the lookback period, which is set at 125 days (6 months) by default. It can be calculated using the original "simple" definition used for the original Squeeze indicator or you can add the same complicated definition that is used to calculate the complicated Squeeze.
By default, only the "simple" definition is used and the Bulge is not displayed. This allows users to continue to use the indicator as before without needing to understand the changes. However, you can choose to use the "complicated" definition or the Bulge in the settings. If you choose to use the "complicated" definition, it will still use the "simple" definition as well and it will apply the "complicated" definition to the Bulge calculations as well. You cannot use one type for the Squeeze and a different type for the Bulge.
הערות שחרור
There was a typo that was causing the Bulge to be displayed improperly. It was showing a Bulge even as BandWidth was decreasing, which is incorrect. This has been fixed.הערות שחרור
Additional errors found and fixed.סקריפט קוד פתוח
ברוח האמיתית של TradingView, יוצר הסקריפט הזה הפך אותו לקוד פתוח, כך שסוחרים יוכלו לעיין בו ולאמת את פעולתו. כל הכבוד למחבר! אמנם ניתן להשתמש בו בחינם, אך זכור כי פרסום חוזר של הקוד כפוף ל־כללי הבית שלנו.
כתב ויתור
המידע והפרסומים אינם מיועדים להיות, ואינם מהווים, ייעוץ או המלצה פיננסית, השקעתית, מסחרית או מכל סוג אחר המסופקת או מאושרת על ידי TradingView. קרא עוד ב־תנאי השימוש.
סקריפט קוד פתוח
ברוח האמיתית של TradingView, יוצר הסקריפט הזה הפך אותו לקוד פתוח, כך שסוחרים יוכלו לעיין בו ולאמת את פעולתו. כל הכבוד למחבר! אמנם ניתן להשתמש בו בחינם, אך זכור כי פרסום חוזר של הקוד כפוף ל־כללי הבית שלנו.
כתב ויתור
המידע והפרסומים אינם מיועדים להיות, ואינם מהווים, ייעוץ או המלצה פיננסית, השקעתית, מסחרית או מכל סוג אחר המסופקת או מאושרת על ידי TradingView. קרא עוד ב־תנאי השימוש.