OPEN-SOURCE SCRIPT
מעודכן Strat Trail Stop by AlexsOptions

What does this script do?
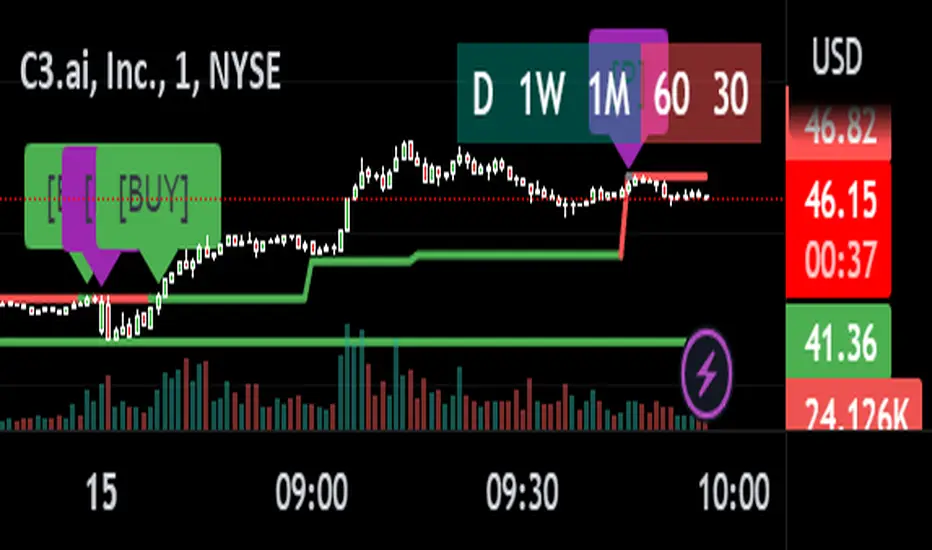
This script plots previous aggregation highs or lows based on the trend of the candles.
Scenario 1 -> Up Trend
If the previous high of a candle is violated the green trail line will trail using the lows of the prior candle. It will continue until a previous low is violated. Once a previous low is violated it will switch to scenario 2
Scenario 2 -> Down Trend
If the previous low of a candle is violated the red trail line will trail using the highs of the prior candle. It will continue until a previous high is violated. Once a previous high is violated it will switch to scenario 1
This indicator has two trails. One is expected to be a lower timeframe the other a higher timeframe.
The higher timeframe has an option to instead use the open of the higher timeframe instead of the trail logic in the scenarios above.
If selected it will plot the open of the designated timeframe, the color will be green if trading above and red if trading below
This script is best used in conjunction with a good understanding of #TheStrat trading strategy. You are then able to create alerts for when your positions fall out of favor.
הערות שחרור
Started adding buy and sell signals based on trail stop continuity [same colors] and negating continuity.Currently only the buyside will be working as this is a work in progress.
Thanks for checking it out!
סקריפט קוד פתוח
ברוח האמיתית של TradingView, יוצר הסקריפט הזה הפך אותו לקוד פתוח, כך שסוחרים יוכלו לעיין בו ולאמת את פעולתו. כל הכבוד למחבר! אמנם ניתן להשתמש בו בחינם, אך זכור כי פרסום חוזר של הקוד כפוף ל־כללי הבית שלנו.
כתב ויתור
המידע והפרסומים אינם מיועדים להיות, ואינם מהווים, ייעוץ או המלצה פיננסית, השקעתית, מסחרית או מכל סוג אחר המסופקת או מאושרת על ידי TradingView. קרא עוד ב־תנאי השימוש.