OPEN-SOURCE SCRIPT
Mtl Weekly

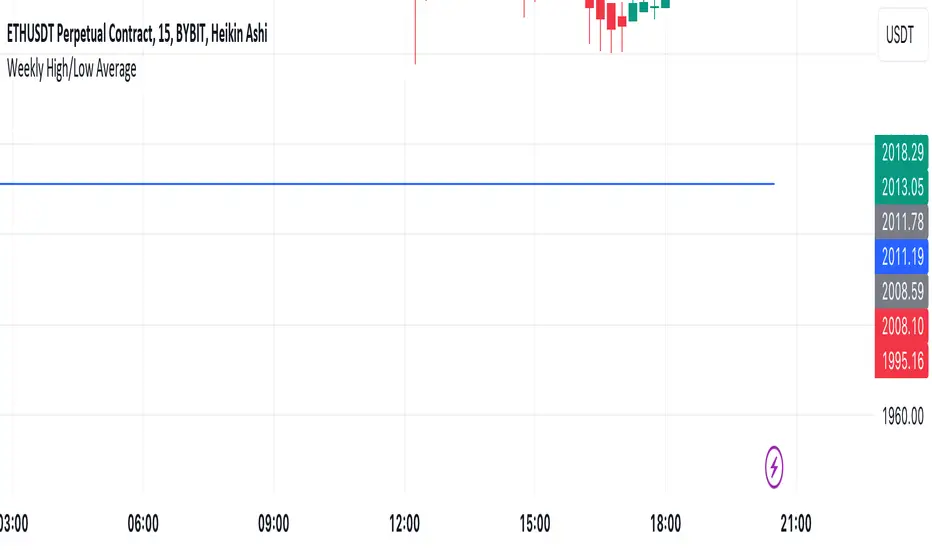
This Pine Script indicator for TradingView calculates and plots a line on the weekly chart, representing the average of the weekly high and low prices. The script uses conditional statements to determine and update the weekly high and low values. The calculated average is then plotted as a line on the chart in blue color. This indicator helps visualize the central point between weekly highs and lows, providing insights into potential trend directions.
סקריפט קוד פתוח
ברוח האמיתית של TradingView, יוצר הסקריפט הזה הפך אותו לקוד פתוח, כך שסוחרים יוכלו לעיין בו ולאמת את פעולתו. כל הכבוד למחבר! אמנם ניתן להשתמש בו בחינם, אך זכור כי פרסום חוזר של הקוד כפוף ל־כללי הבית שלנו.
כתב ויתור
המידע והפרסומים אינם מיועדים להיות, ואינם מהווים, ייעוץ או המלצה פיננסית, השקעתית, מסחרית או מכל סוג אחר המסופקת או מאושרת על ידי TradingView. קרא עוד ב־תנאי השימוש.