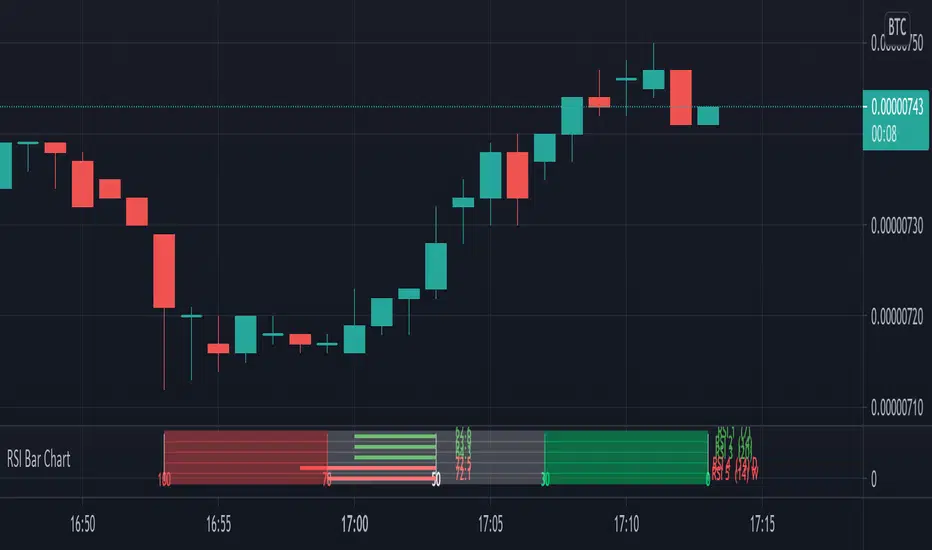
A different way to plot several RSI at once,
5 RSI with different options:
- source, length, timeframe
- size of indicator (width)
- color change
- limit change (30, 70), labels will be changed accordingly
- type of RSI line (line, arrow), linewidth
- offset label (at the right)
There are 4 colors (RSI line)
- when RSI > sell limit
- when RSI > 50 but below sell limit
- when RSI < 50 but above buy limit
- when RSI < buy limit


Arrows:

Different size:


Cheers!
5 RSI with different options:
- source, length, timeframe
- size of indicator (width)
- color change
- limit change (30, 70), labels will be changed accordingly
- type of RSI line (line, arrow), linewidth
- offset label (at the right)
There are 4 colors (RSI line)
- when RSI > sell limit
- when RSI > 50 but below sell limit
- when RSI < 50 but above buy limit
- when RSI < buy limit
Arrows:
Different size:
Cheers!
הערות שחרור
Now every number (label) is changed when the label size is adjustedAlso shortened the script by adding f_rsi()
הערות שחרור
Small bug fix -> labels at the right are now visible on symbols sessions that stop in the weekendהערות שחרור
Blurry text/lines fixהערות שחרור
Updateסקריפט קוד פתוח
ברוח האמיתית של TradingView, יוצר הסקריפט הזה הפך אותו לקוד פתוח, כך שסוחרים יוכלו לעיין בו ולאמת את פעולתו. כל הכבוד למחבר! אמנם ניתן להשתמש בו בחינם, אך זכור כי פרסום חוזר של הקוד כפוף ל־כללי הבית שלנו.
Who are PineCoders?
tradingview.com/chart/SSP/yW5eOqtm-Who-are-PineCoders/
TG Pine Script® Q&A: t.me/PineCodersQA
- We cannot control our emotions,
but we can control our keyboard -
tradingview.com/chart/SSP/yW5eOqtm-Who-are-PineCoders/
TG Pine Script® Q&A: t.me/PineCodersQA
- We cannot control our emotions,
but we can control our keyboard -
כתב ויתור
המידע והפרסומים אינם מיועדים להיות, ואינם מהווים, ייעוץ או המלצה פיננסית, השקעתית, מסחרית או מכל סוג אחר המסופקת או מאושרת על ידי TradingView. קרא עוד ב־תנאי השימוש.
סקריפט קוד פתוח
ברוח האמיתית של TradingView, יוצר הסקריפט הזה הפך אותו לקוד פתוח, כך שסוחרים יוכלו לעיין בו ולאמת את פעולתו. כל הכבוד למחבר! אמנם ניתן להשתמש בו בחינם, אך זכור כי פרסום חוזר של הקוד כפוף ל־כללי הבית שלנו.
Who are PineCoders?
tradingview.com/chart/SSP/yW5eOqtm-Who-are-PineCoders/
TG Pine Script® Q&A: t.me/PineCodersQA
- We cannot control our emotions,
but we can control our keyboard -
tradingview.com/chart/SSP/yW5eOqtm-Who-are-PineCoders/
TG Pine Script® Q&A: t.me/PineCodersQA
- We cannot control our emotions,
but we can control our keyboard -
כתב ויתור
המידע והפרסומים אינם מיועדים להיות, ואינם מהווים, ייעוץ או המלצה פיננסית, השקעתית, מסחרית או מכל סוג אחר המסופקת או מאושרת על ידי TradingView. קרא עוד ב־תנאי השימוש.