OPEN-SOURCE SCRIPT
מעודכן Stablecoin supplies [USD bn]
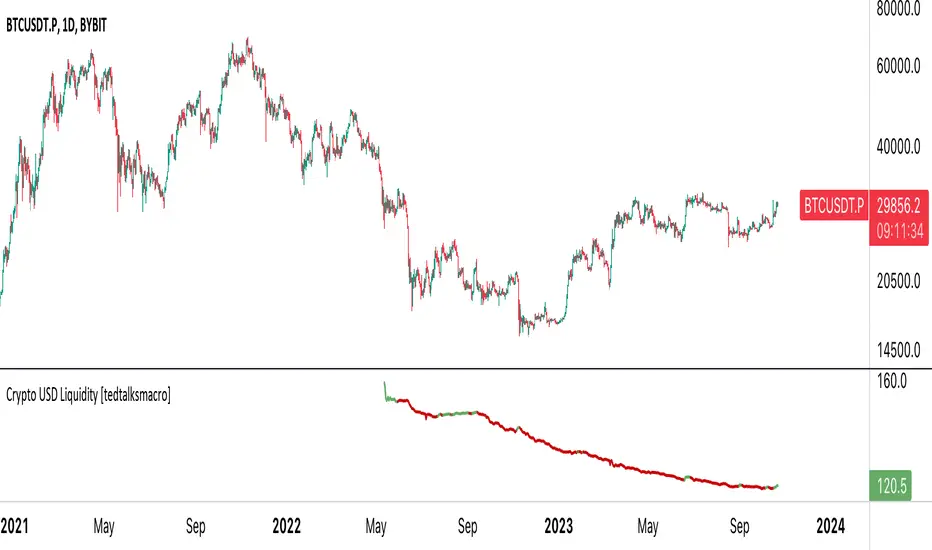
This script shows crypto market inflows/outflows by showing the USD stablecoin supplies, using data from https://glassnode.com/:
 BUSD_SUPPLY
 USDT_SUPPLY
 USDC_SUPPLY
Using a simple 20 EMA, the line will change color showing stablecoin inflow or outflow. Traders can consider stable coin inflows (green) as bullish for Bitcoin price, while stable coin outflows (red) should be considered bearish for price.
Using a simple 20 EMA, the line will change color showing stablecoin inflow or outflow. Traders can consider stable coin inflows (green) as bullish for Bitcoin price, while stable coin outflows (red) should be considered bearish for price.
הערות שחרור
Script title updateהערות שחרור
Designed to visualize the total liquidity of major stablecoins in the cryptocurrency market. The liquidity is calculated by summing the supply values of five leading stablecoins: USDT, BUSD, USDC, DAI, and TUSD. Based on the comparison of the current liquidity value with its EMA, the script colors the plotted line either green (when above the EMA) or red (when below the EMA), helping traders visually identify bullish or bearish liquidity trends.
סקריפט קוד פתוח
ברוח האמיתית של TradingView, יוצר הסקריפט הזה הפך אותו לקוד פתוח, כך שסוחרים יוכלו לעיין בו ולאמת את פעולתו. כל הכבוד למחבר! אמנם ניתן להשתמש בו בחינם, אך זכור כי פרסום חוזר של הקוד כפוף ל־כללי הבית שלנו.
כתב ויתור
המידע והפרסומים אינם מיועדים להיות, ואינם מהווים, ייעוץ או המלצה פיננסית, השקעתית, מסחרית או מכל סוג אחר המסופקת או מאושרת על ידי TradingView. קרא עוד ב־תנאי השימוש.