PROTECTED SOURCE SCRIPT
Mtf Rsi Supply/Demand Zones
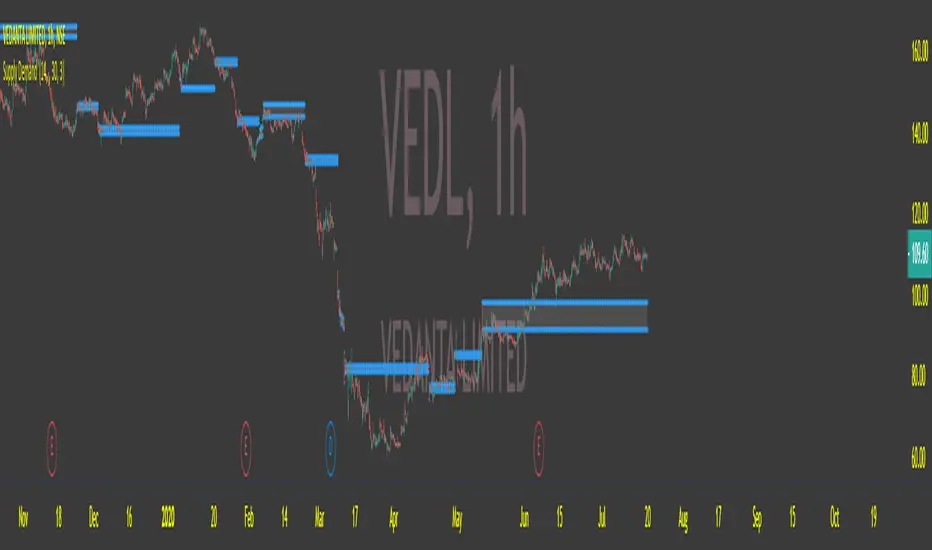
This scripts draws supply and demand zones based on the RSI indicator. For example if RSI is under 30 a supply zone is drawn on the chart and extended for as long as there isn't a new crossunder 30. Same goes for above 70. The threshold which by default is set to 30, which means 30 is added to 0 and subtracted from 100 to give us the classic 30/70 threshold on RSI , can be set in the indicator settings.
By only plotting the Demand Below Supply Above indicator you get automatic SD level that is updated every time RSI reaches either 30 or 70. If you plot the Resistance Zone / Support Zone you get an indicator that extends the zone instead of overwrite the earlier zone. Due to the zone being extended the chart can get a bit messy if there isn't a clear range going on.
There is also a "confirmation bars" setting where you can tell the script how many bars under over 30 / 70 you want before a zone is drawn.As you can see, this could be useful "Price Flow" indicator, where we would only short if a zone appears below another zone, or long if two zones in a row are going up, like stairs.
סקריפט מוגן
סקריפט זה פורסם כמקור סגור. עם זאת, תוכל להשתמש בו בחופשיות וללא כל מגבלות – למד עוד כאן
כתב ויתור
המידע והפרסומים אינם מיועדים להיות, ואינם מהווים, ייעוץ או המלצה פיננסית, השקעתית, מסחרית או מכל סוג אחר המסופקת או מאושרת על ידי TradingView. קרא עוד ב־תנאי השימוש.
סקריפט מוגן
סקריפט זה פורסם כמקור סגור. עם זאת, תוכל להשתמש בו בחופשיות וללא כל מגבלות – למד עוד כאן
כתב ויתור
המידע והפרסומים אינם מיועדים להיות, ואינם מהווים, ייעוץ או המלצה פיננסית, השקעתית, מסחרית או מכל סוג אחר המסופקת או מאושרת על ידי TradingView. קרא עוד ב־תנאי השימוש.