OPEN-SOURCE SCRIPT
מעודכן ADX and DI+ v4.5 Optimized
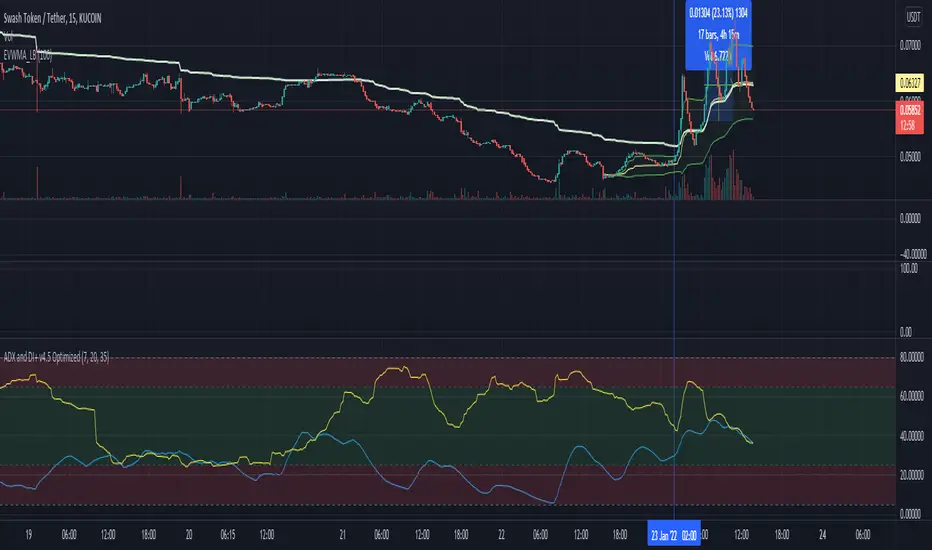
This script plots VWMA(ADX) vs EMA(DI+) under pre-set time frame.
Feature:
The Main Strategy is to look for potential BUY opportunity (Intraday trading, Session trading, Swing) when EMA(DI+) colored blue, entering upward into Green zone where ADX counterpart (default colored: Yellow) is also present.
Formula plot is also helpful to understand upcoming downtrend signal when both blue and yellow lines try to make diverted bifurcation like pattern on graph.
Disclaimer- This is an indicator script and not final Buy and Sell advice.
* Originally developed by © BeikabuOyaji and further extended & optimized by Bharat imbharat to serve above features
הערות שחרור
Some minor format corrections.Script is intact.
סקריפט קוד פתוח
ברוח האמיתית של TradingView, יוצר הסקריפט הזה הפך אותו לקוד פתוח, כך שסוחרים יוכלו לעיין בו ולאמת את פעולתו. כל הכבוד למחבר! אמנם ניתן להשתמש בו בחינם, אך זכור כי פרסום חוזר של הקוד כפוף ל־כללי הבית שלנו.
כתב ויתור
המידע והפרסומים אינם מיועדים להיות, ואינם מהווים, ייעוץ או המלצה פיננסית, השקעתית, מסחרית או מכל סוג אחר המסופקת או מאושרת על ידי TradingView. קרא עוד ב־תנאי השימוש.