OPEN-SOURCE SCRIPT
Interactive trendline
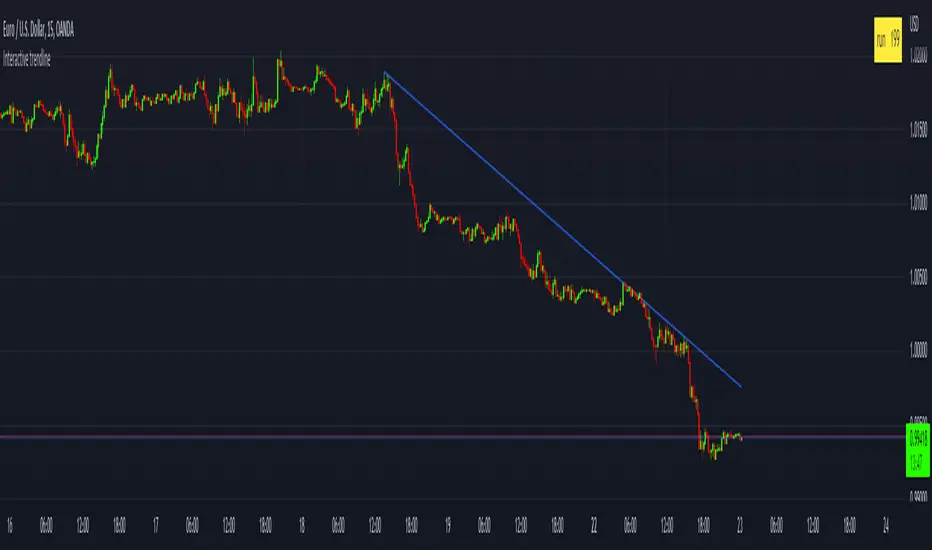
This is a concept that I have been playing with
to make a manual trend line that has more then just two connecting dots
but that has sequential data connected on every bar between the
beginning an the end point that can then be used to determine a break of trend or
a bounce.
This is added in a few simple steps
1) add the indicator to your chart
2) set the x_1 time bar
3) set the y_1 price
4) set the x_2 time bar
5) set the y_2 price
6) check the table that calculated the run value and enter that value in the settings box in the "Run" input box
סקריפט קוד פתוח
ברוח האמיתית של TradingView, יוצר הסקריפט הזה הפך אותו לקוד פתוח, כך שסוחרים יוכלו לעיין בו ולאמת את פעולתו. כל הכבוד למחבר! אמנם ניתן להשתמש בו בחינם, אך זכור כי פרסום חוזר של הקוד כפוף ל־כללי הבית שלנו.
כתב ויתור
המידע והפרסומים אינם מיועדים להיות, ואינם מהווים, ייעוץ או המלצה פיננסית, השקעתית, מסחרית או מכל סוג אחר המסופקת או מאושרת על ידי TradingView. קרא עוד ב־תנאי השימוש.