PROTECTED SOURCE SCRIPT
Global Market Signals: EMA ROC
Welcome!
Thanks for checking out my indicator.
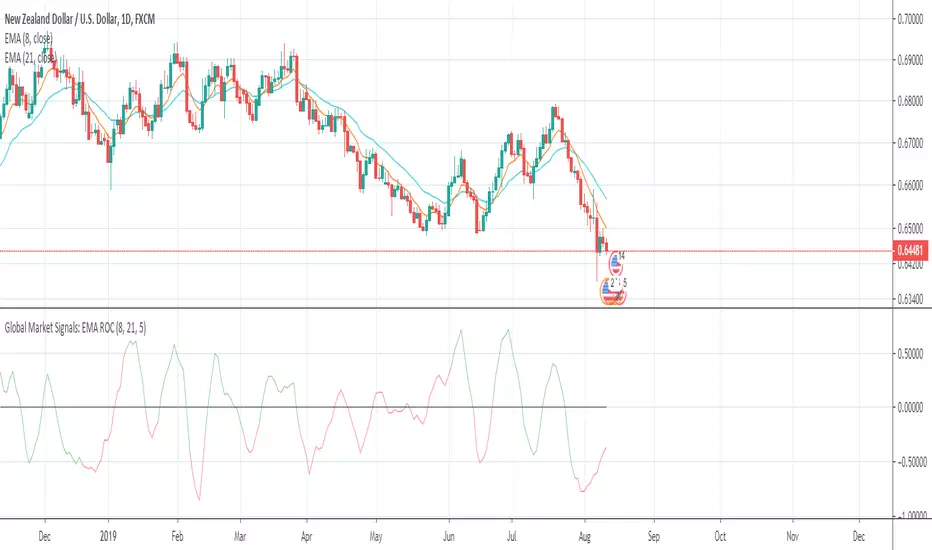
This is the difference in the rate of change between two exponential moving averages.
The colors are green and red:
- Green is when the fast EMA > slow EMA
- Red is when the fast EMA < slow EMA
When the indicator approaches it's upper or lower limits, it will indicate either sideways price movement or a reversal. When the color changes around it's upper or lower limits from green to red or vice-versa, an EMA crossover just occurred and a continuation of trend is possible before a pause or reversal in price.
I hope this helps!
Andre
Global Market Signals
Thanks for checking out my indicator.
This is the difference in the rate of change between two exponential moving averages.
The colors are green and red:
- Green is when the fast EMA > slow EMA
- Red is when the fast EMA < slow EMA
When the indicator approaches it's upper or lower limits, it will indicate either sideways price movement or a reversal. When the color changes around it's upper or lower limits from green to red or vice-versa, an EMA crossover just occurred and a continuation of trend is possible before a pause or reversal in price.
I hope this helps!
Andre
Global Market Signals
סקריפט מוגן
סקריפט זה פורסם כמקור סגור. עם זאת, תוכל להשתמש בו בחופשיות וללא כל מגבלות – למד עוד כאן
כתב ויתור
המידע והפרסומים אינם מיועדים להיות, ואינם מהווים, ייעוץ או המלצה פיננסית, השקעתית, מסחרית או מכל סוג אחר המסופקת או מאושרת על ידי TradingView. קרא עוד ב־תנאי השימוש.
סקריפט מוגן
סקריפט זה פורסם כמקור סגור. עם זאת, תוכל להשתמש בו בחופשיות וללא כל מגבלות – למד עוד כאן
כתב ויתור
המידע והפרסומים אינם מיועדים להיות, ואינם מהווים, ייעוץ או המלצה פיננסית, השקעתית, מסחרית או מכל סוג אחר המסופקת או מאושרת על ידי TradingView. קרא עוד ב־תנאי השימוש.