OPEN-SOURCE SCRIPT
מעודכן BB Support & Resistance

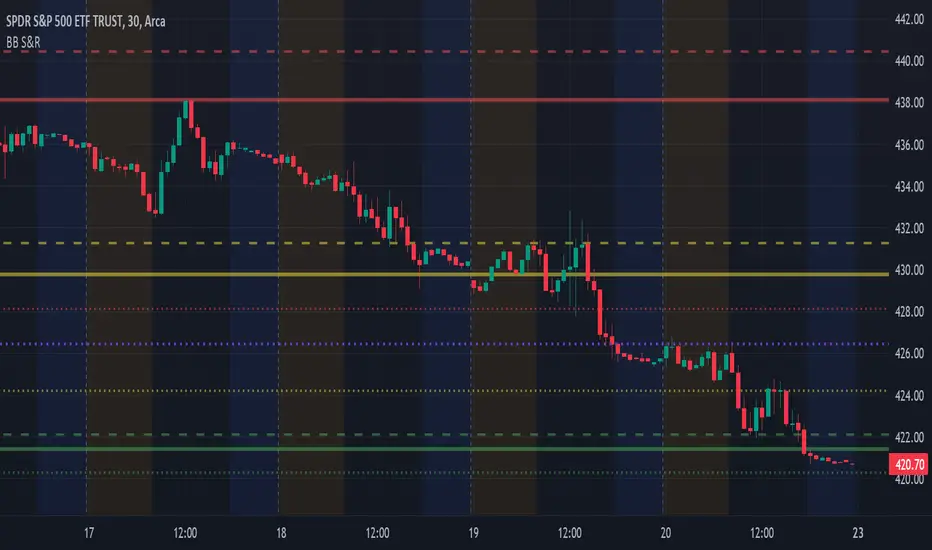
Choosing support and resistance can be time consuming and subjective. Personally, I don't want to spend too much time manually marking up charts. Credit to video I saw, forget the producer, that demonstrated how multi-time frame Bollinger Bands can act as support and resistance. I suggest reading up on Bollinger Bands (en.wikipedia.org/wiki/Bollinger_Bands) and how to trade them. This indicator draws support and resistance lines based on Bollinger Bands on three time frames. You can select 1 or all three time frames to display on your chart. Enjoy.
הערות שחרור
Choosing support and resistance can be time consuming and subjective. Personally, I don't want to spend too much time manually marking up charts. Credit to video I saw, forget the producer, that demonstrated how multi-time frame Bollinger Bands can act as support and resistance. I suggest reading up on Bollinger Bands (en.wikipedia.org/wiki/Bollinger Bands) and how to use them in your trading. This indicator draws support and resistance lines based on Bollinger Bands on three time frames. You can select 1 or all three time frames to display on your chart. Enjoy.Updated...Added option to set S&R line colors by time frame.
סקריפט קוד פתוח
ברוח האמיתית של TradingView, יוצר הסקריפט הזה הפך אותו לקוד פתוח, כך שסוחרים יוכלו לעיין בו ולאמת את פעולתו. כל הכבוד למחבר! אמנם ניתן להשתמש בו בחינם, אך זכור כי פרסום חוזר של הקוד כפוף ל־כללי הבית שלנו.
כתב ויתור
המידע והפרסומים אינם מיועדים להיות, ואינם מהווים, ייעוץ או המלצה פיננסית, השקעתית, מסחרית או מכל סוג אחר המסופקת או מאושרת על ידי TradingView. קרא עוד ב־תנאי השימוש.