PROTECTED SOURCE SCRIPT
Dividend Percentile Rank

What it does
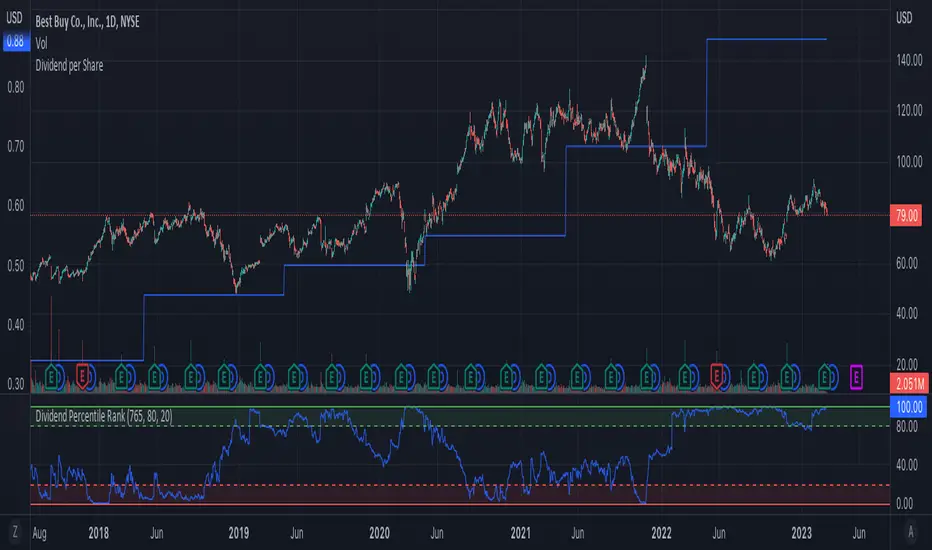
The Indicator plots the percentile rank of the current dividend yield within the configured lookback timeframe. A percentile rank of 80 means that in 80% of the time within the lookback period the dividend yield was below the current yield. And in the remaining 20% of the time it was above the current yield. While a percentile rank of 0 means that the current dividend yield is below all historical dividend yields within the lookback timeframe.
You can configure three values:
1. Lookback Trading Days: This is the timeframe of past trading days that are used to calculate the percentile rank. The default value is 765 days (~3years) while one trading year is about 252 days.
2. Buy threshold in %: Configures the green zone of the Dividend Percentile Chart
3. Buy threshold in %: Configures the red zone of the Dividend Percentile Chart
How it works
First, the Dividend Yield is calculated. After that, the dividend Yield is used to calculate the percentage rank within the configured lookback period. The result is plotted depending on the configured threshold zones.
What you can use it for
The Dividend Percentile Rank is plotted as an oscillator that oscillates between 0 and 100.
High values, e.g. above 80, can be considered as a buy signal as the current dividend yield is high in comparison to past dividend yields.
Low values, e.g. below 20, can be considered as a sell signal as the current dividend yield is lower in comparison to past dividend yields.
(PS: Always take into consideration to evaluate the companies ability to continue paying dividends in the future. The yield alone is no guarantee for high returns)
סקריפט מוגן
סקריפט זה פורסם כמקור סגור. עם זאת, תוכל להשתמש בו בחופשיות וללא כל מגבלות – למד עוד כאן
כתב ויתור
המידע והפרסומים אינם מיועדים להיות, ואינם מהווים, ייעוץ או המלצה פיננסית, השקעתית, מסחרית או מכל סוג אחר המסופקת או מאושרת על ידי TradingView. קרא עוד ב־תנאי השימוש.
סקריפט מוגן
סקריפט זה פורסם כמקור סגור. עם זאת, תוכל להשתמש בו בחופשיות וללא כל מגבלות – למד עוד כאן
כתב ויתור
המידע והפרסומים אינם מיועדים להיות, ואינם מהווים, ייעוץ או המלצה פיננסית, השקעתית, מסחרית או מכל סוג אחר המסופקת או מאושרת על ידי TradingView. קרא עוד ב־תנאי השימוש.