OPEN-SOURCE SCRIPT
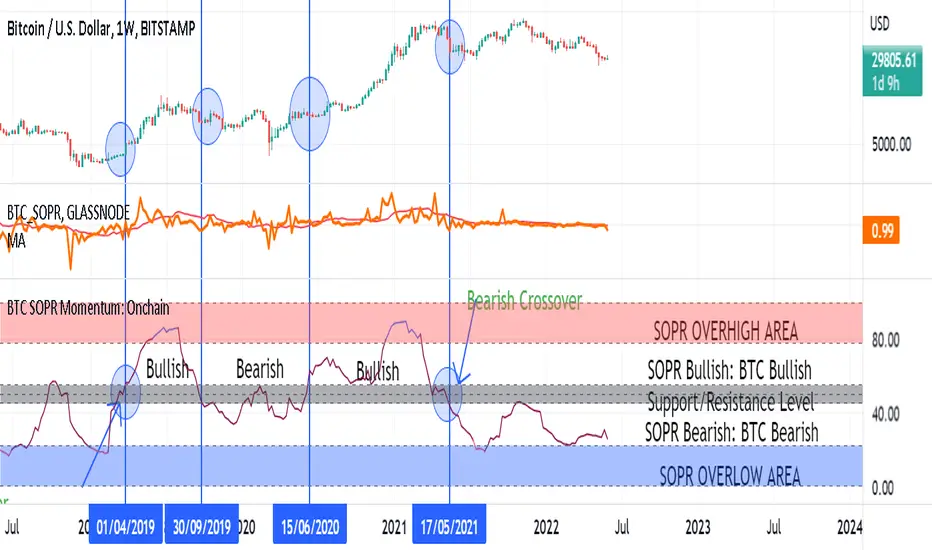
BTC SOPR Momentum: Onchain

This Onchin metric is based on SOPR data
Use this metric on daily and weekly timeframes:
SOPR:
The Spent Output Profit Ratio (SOPR) is computed by dividing the realized value (in USD) divided by the value at creation (USD) of a spent output. Or simply: price sold / price paid. Renato Shirakashi created this metric. When SOPR > 1, it means that the owners of the spent outputs are in profit at the time of the transaction; otherwise, they are at a loss. You can find "SOPR" in tradingview indicators
BTC SOPR Momentum: Onchain
This metric is based on SOPR Momentum. I made some changes to it so that its momentum can be checked.
Interpretation:
If the indicator is above the gray level of resistance/support, bitcoin has an uptrend and Bullish bias
If the indicator is below the resistance/ support level, bitcoin has a downtrend and Bearish Bias
Crossup the gray level is a long signal
Cross-down the gray level is a shorts signal
Entering and exit of the indicator to the overhigh area means creating a top
Entering and leaving the indicator to the overflow area means creating a bottom
סקריפט קוד פתוח
ברוח האמיתית של TradingView, יוצר הסקריפט הזה הפך אותו לקוד פתוח, כך שסוחרים יוכלו לעיין בו ולאמת את פעולתו. כל הכבוד למחבר! אמנם ניתן להשתמש בו בחינם, אך זכור כי פרסום חוזר של הקוד כפוף ל־כללי הבית שלנו.
כתב ויתור
המידע והפרסומים אינם מיועדים להיות, ואינם מהווים, ייעוץ או המלצה פיננסית, השקעתית, מסחרית או מכל סוג אחר המסופקת או מאושרת על ידי TradingView. קרא עוד ב־תנאי השימוש.