OPEN-SOURCE SCRIPT
Next Candle Predictor with Auto Hedging
The "Next Candle Predictor with Auto Hedging" is a Pine Script indicator designed for use on TradingView. It combines predictive analysis and basic hedging techniques to assist traders in making informed decisions. Here's a detailed explanation suitable for public sharing on TradingView:
Overview
This script predicts the closing price of the next candle based on the current candle's open and close prices. It also includes an auto hedging feature that suggests potential hedging levels to mitigate risk based on the predicted price movement. The indicator is particularly useful for traders looking to enhance their trading strategies with predictive analytics.
Key Features
Next Candle Prediction:
The indicator analyzes the current candle's data (open and close prices) to predict whether the next candle will close higher or lower.
If the current candle is bullish (close > open), it predicts a higher close for the next candle. Conversely, if the candle is bearish, it predicts a lower close.
Auto Hedging:
The script calculates a hedging level based on the predicted close price.
If the predicted close indicates a bullish move, the hedge level is set slightly below the predicted close, suggesting where a trader might consider placing a hedge. If the prediction indicates a bearish move, the hedge level is set above the predicted close.
Elliott Wave Analysis:
The script includes a basic implementation of identifying significant price movements, akin to Elliott Wave analysis, by detecting peaks and troughs over a specified number of bars (wave length).
This can help traders identify potential trend reversals or continuations.
How It Works
Input Parameters: Users can customize the waveLength parameter, which determines how many bars back the script looks to identify significant highs and lows.
Peak and Trough Detection: The script identifies the highest high and lowest low within the specified wave length, plotting these points on the chart for visual reference.
Prediction Logic: The predicted close is calculated based on the current candle's behavior, allowing traders to anticipate price movements.
Hedging Level Calculation: The script dynamically calculates a hedging level based on the predicted close, providing a visual cue for potential risk management strategies.
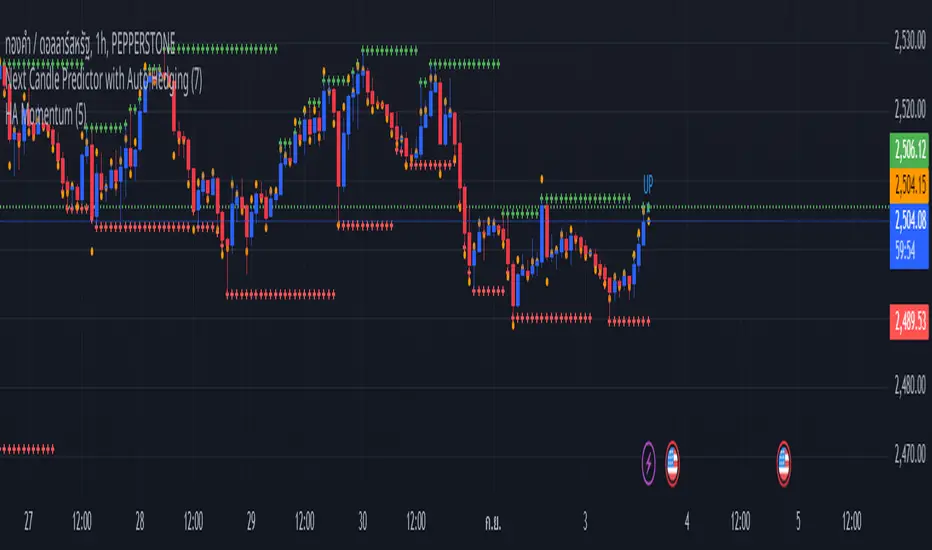
Visual Representation
The indicator plots:
Elliott Wave Highs: Marked in green.
Elliott Wave Lows: Marked in red.
Predicted Close: Shown as a blue step line.
Hedge Level: Displayed as an orange step line.
Benefits
Enhanced Decision-Making: By providing predictions and potential hedging levels, traders can make more informed decisions about entering or exiting positions.
Risk Management: The auto hedging feature helps traders manage risk by suggesting levels where they might place hedges against adverse price movements.
Customizable: The script allows for user-defined parameters, making it adaptable to different trading strategies and market conditions.
Conclusion
The "Next Candle Predictor with Auto Hedging" indicator is a powerful tool for traders seeking to enhance their trading strategies with predictive analytics and risk management techniques. By utilizing this indicator, traders can gain insights into potential price movements and make more informed trading decisions.
Feel free to explore the script, customize it to fit your trading style, and engage with the TradingView community for further insights and improvements!
Related
Overview
This script predicts the closing price of the next candle based on the current candle's open and close prices. It also includes an auto hedging feature that suggests potential hedging levels to mitigate risk based on the predicted price movement. The indicator is particularly useful for traders looking to enhance their trading strategies with predictive analytics.
Key Features
Next Candle Prediction:
The indicator analyzes the current candle's data (open and close prices) to predict whether the next candle will close higher or lower.
If the current candle is bullish (close > open), it predicts a higher close for the next candle. Conversely, if the candle is bearish, it predicts a lower close.
Auto Hedging:
The script calculates a hedging level based on the predicted close price.
If the predicted close indicates a bullish move, the hedge level is set slightly below the predicted close, suggesting where a trader might consider placing a hedge. If the prediction indicates a bearish move, the hedge level is set above the predicted close.
Elliott Wave Analysis:
The script includes a basic implementation of identifying significant price movements, akin to Elliott Wave analysis, by detecting peaks and troughs over a specified number of bars (wave length).
This can help traders identify potential trend reversals or continuations.
How It Works
Input Parameters: Users can customize the waveLength parameter, which determines how many bars back the script looks to identify significant highs and lows.
Peak and Trough Detection: The script identifies the highest high and lowest low within the specified wave length, plotting these points on the chart for visual reference.
Prediction Logic: The predicted close is calculated based on the current candle's behavior, allowing traders to anticipate price movements.
Hedging Level Calculation: The script dynamically calculates a hedging level based on the predicted close, providing a visual cue for potential risk management strategies.
Visual Representation
The indicator plots:
Elliott Wave Highs: Marked in green.
Elliott Wave Lows: Marked in red.
Predicted Close: Shown as a blue step line.
Hedge Level: Displayed as an orange step line.
Benefits
Enhanced Decision-Making: By providing predictions and potential hedging levels, traders can make more informed decisions about entering or exiting positions.
Risk Management: The auto hedging feature helps traders manage risk by suggesting levels where they might place hedges against adverse price movements.
Customizable: The script allows for user-defined parameters, making it adaptable to different trading strategies and market conditions.
Conclusion
The "Next Candle Predictor with Auto Hedging" indicator is a powerful tool for traders seeking to enhance their trading strategies with predictive analytics and risk management techniques. By utilizing this indicator, traders can gain insights into potential price movements and make more informed trading decisions.
Feel free to explore the script, customize it to fit your trading style, and engage with the TradingView community for further insights and improvements!
Related
סקריפט קוד פתוח
ברוח האמיתית של TradingView, יוצר הסקריפט הזה הפך אותו לקוד פתוח, כך שסוחרים יוכלו לעיין בו ולאמת את פעולתו. כל הכבוד למחבר! אמנם ניתן להשתמש בו בחינם, אך זכור כי פרסום חוזר של הקוד כפוף ל־כללי הבית שלנו.
כתב ויתור
המידע והפרסומים אינם מיועדים להיות, ואינם מהווים, ייעוץ או המלצה פיננסית, השקעתית, מסחרית או מכל סוג אחר המסופקת או מאושרת על ידי TradingView. קרא עוד ב־תנאי השימוש.