OPEN-SOURCE SCRIPT
Price above/below EMA
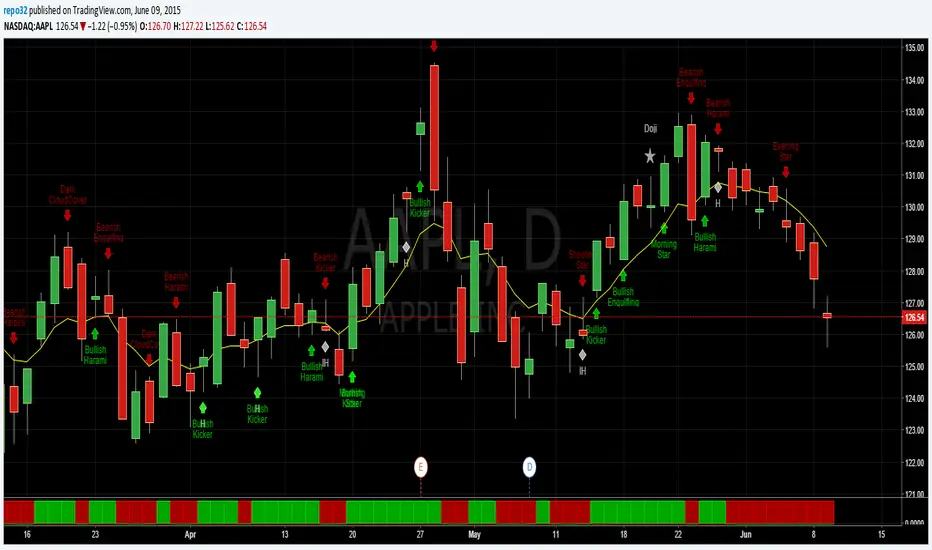
This script will give you red/green columns to indicate if price is above or below a certain EMA. With Candlestick charting, we are looking for price in relation to the 8 ema Trigger Line (T-Line). You can adjust this indicator to fit your need. Simple, but nice to quickly see.
Oops. Last line's title should be "Sell". Doesn't affect display though.
Oops. Last line's title should be "Sell". Doesn't affect display though.
סקריפט קוד פתוח
ברוח האמיתית של TradingView, יוצר הסקריפט הזה הפך אותו לקוד פתוח, כך שסוחרים יוכלו לעיין בו ולאמת את פעולתו. כל הכבוד למחבר! אמנם ניתן להשתמש בו בחינם, אך זכור כי פרסום חוזר של הקוד כפוף ל־כללי הבית שלנו.
פרסומים קשורים
כתב ויתור
המידע והפרסומים אינם מיועדים להיות, ואינם מהווים, ייעוץ או המלצה פיננסית, השקעתית, מסחרית או מכל סוג אחר המסופקת או מאושרת על ידי TradingView. קרא עוד ב־תנאי השימוש.