PINE LIBRARY
מעודכן CommonMarkup
Library "CommonMarkup"
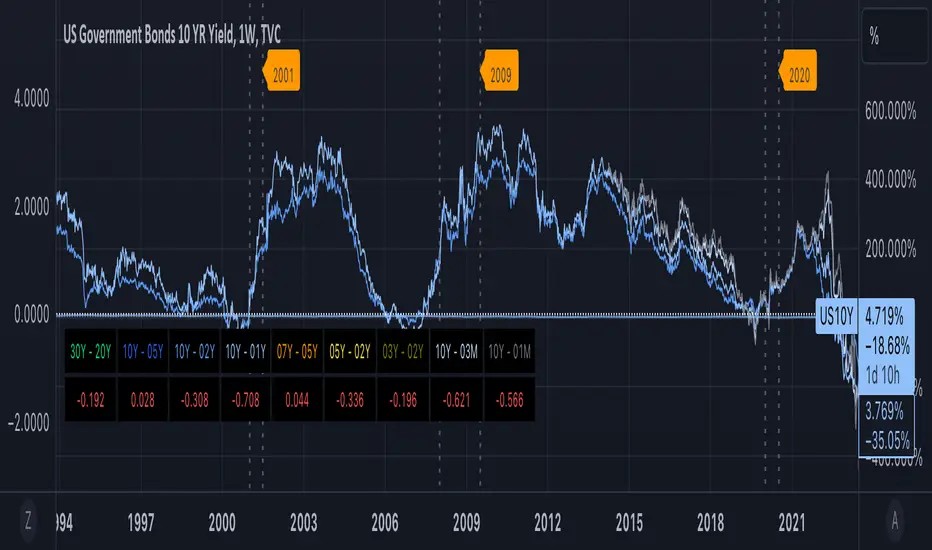
Provides functions for chart markup, such as indicating recession bands.
markRecessionBands(showBands, lineY, labelY)
Mark vertical bands and show recession band labels if argument showBands is true. Example "markRecessionBands(bar_index[0],3.0"
Parameters:
showBands: - show vertical recession bands when true. Functionally equiv to no op when false
lineY: - y-axis value for line positioning
labelY: - y-axis value for label positioning
return true - always answers the value of showBands
הערות שחרור
Common markup lib v2. Changes as follows:- Added 2022 contraction over Q1 to Q2
- Updated time refs to be UTC+0
הערות שחרור
Minor cosmetic rendering updatesהערות שחרור
v4 - minor display and formatting updates for readabilityהערות שחרור
v5Added control parameter for defining if 2 consecutive quarters of negative GDP is considered a recession
Updated:
markRecessionBands(showBands, twoQrtsOfNegativeGDPIsRecession, lineY, labelY)
Mark vertical bands and show recession band labels if argument showBands is true. Example "markRecessionBands(bar_index[0],3.0"
Parameters:
showBands: - show vertical recession bands when true. Functionally equiv to no op when false
twoQrtsOfNegativeGDPIsRecession: - if true, then periods with two consecutive quarters of negative GDP is considered a recession. Defaut is false.
lineY: - y-axis value for line positioning
labelY: - y-axis value for label positioning
return true - always answers the value of showBands
הערות שחרור
v6Updated:
markRecessionBands(showBands, twoQrtsOfNegativeGDPIsRecession, labelY)
Mark vertical bands and show recession band labels if argument showBands is true. Example "markRecessionBands(bar_index[0],false3.0)"
Parameters:
showBands (bool): - show vertical recession bands when true. Functionally equiv to no op when false
twoQrtsOfNegativeGDPIsRecession (bool): - if true, then periods with two consecutive quarters of negative GDP are considered a recession. Defaut is false.
labelY (float): - y-axis value for label positioning
return true - always answers the value of showBands
הערות שחרור
v7Updated:
- Resolved issue with private function for drawing recession bands scaling the y-axis excessively
ספריית Pine
ברוח האמיתית של TradingView, המחבר לפרסם את הקוד של Pine הזה כספרייה בקוד פתוח, כך שמתכנתים אחרים בקהילתנו יעשו שימוש חוזר. כל הכבוד למחבר! ניתן להשתמש בספרייה הזו באופן פרטי או בומים בקוד פתוח, אך השימוש בחוזר בקוד הזה בפרסומים כפוף ל-כללי הבית.
כתב ויתור
המידע והפרסומים אינם מיועדים להיות, ואינם מהווים, ייעוץ או המלצה פיננסית, השקעתית, מסחרית או מכל סוג אחר המסופקת או מאושרת על ידי TradingView. קרא עוד ב־תנאי השימוש.