OPEN-SOURCE SCRIPT
Prometheus TTM Squeeze
The TTM indicator is an indicator used to better understand an underlying’s direction and volatility. Positive values indicate a rising price, negative falling. There is also an element of the underlying's volatility, explained below.
When, in this particular indicator, the zero line is the aqua color, that means that the volatility has picked up. In literal terms, it means that the upper Keltner Channel is above the upper Bollinger Band and the lower Keltner Channel is below the lower Bollinger Band. The range of the Keltner Channels is greater than the range of the Bollinger bands. What this is supposed to correlate to with price action is a more volatile choppier area. See below.

This is an example of volatility picking up being shown as the speed of the underlying. When the line turns aqua the move following tends to be sharp in the respective direction. Not a smooth delivery of price.
Regarding why this script is different from the others, with this script you do not need to input a bar's back value if you do not want to. Bars back being the amount of bars used in the indicator calculation. This is because of the use of Sum of Squared Errors, or SSE. How we do it is we calculate a Simple Moving Average or SMA and the indicator using a lot of different bars back values. Then if there is an event, characterized by the oscillator crossing over or under the 0 line, we subtract the close by the SMA and square it. If there is no event we return a big value, we want the error to be as small as possible. Because we loop over every value for bars back, we get the value with the smallest error. Or the SMA closest to the price ensuring we are following it as close as we can. This also becomes the value used as the multiplier for the Keltner Channels and Bollinger Bands, we simply divide them by 10 to normalize it. This leads to ease of use. A user does not need to worry about finding the best bars back for each ticker and time frame. We have you covered! SSE is not to be regarded to be the best given values for a pocket of the market, simply an estimation.
Of course we have the option for users to enter their own bars back or multipliers. Here is a comparison of the SSE at work and a 20 period bar’s back with 2 as the multiplier on a 4 hour $QQQ.

The top one is the SSE, the bottom is 20. I turned off showing the SMA, and alerts for better visibility. We see the SSE version does not cross above 0 again until the trend totally reverses. I would much rather overestimate risk than underestimate it.
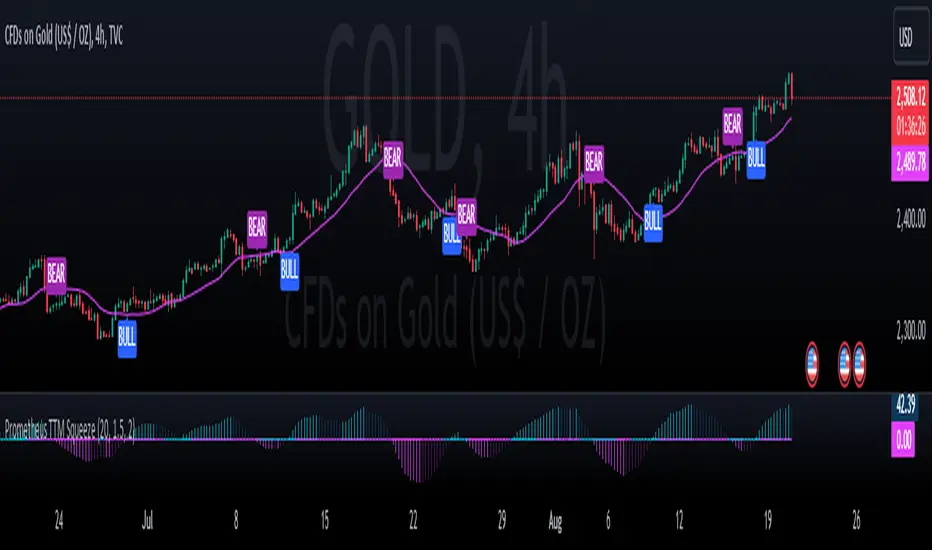
The BULL and BEAR plotted on the chart is a result of the following conditions. A BULL if the price is above our auto optimized SMA and the oscillator crosses over 0. BEAR is the opposite, price below the SMA and an oscillator cross below 0. Here is the Daily $NYSE:PLTR chart to show some.

Users have the options to toggle on and off the BULL and BEAR plots, SMA, as well as input their own lookback and multipliers.
We encourage traders to not follow indicators blindly, none are 100% accurate. SSE does not guarantee that the values generated will be the best for a given moment in time. Please comment on any desired updates, all criticism is welcome!
When, in this particular indicator, the zero line is the aqua color, that means that the volatility has picked up. In literal terms, it means that the upper Keltner Channel is above the upper Bollinger Band and the lower Keltner Channel is below the lower Bollinger Band. The range of the Keltner Channels is greater than the range of the Bollinger bands. What this is supposed to correlate to with price action is a more volatile choppier area. See below.
This is an example of volatility picking up being shown as the speed of the underlying. When the line turns aqua the move following tends to be sharp in the respective direction. Not a smooth delivery of price.
Regarding why this script is different from the others, with this script you do not need to input a bar's back value if you do not want to. Bars back being the amount of bars used in the indicator calculation. This is because of the use of Sum of Squared Errors, or SSE. How we do it is we calculate a Simple Moving Average or SMA and the indicator using a lot of different bars back values. Then if there is an event, characterized by the oscillator crossing over or under the 0 line, we subtract the close by the SMA and square it. If there is no event we return a big value, we want the error to be as small as possible. Because we loop over every value for bars back, we get the value with the smallest error. Or the SMA closest to the price ensuring we are following it as close as we can. This also becomes the value used as the multiplier for the Keltner Channels and Bollinger Bands, we simply divide them by 10 to normalize it. This leads to ease of use. A user does not need to worry about finding the best bars back for each ticker and time frame. We have you covered! SSE is not to be regarded to be the best given values for a pocket of the market, simply an estimation.
Of course we have the option for users to enter their own bars back or multipliers. Here is a comparison of the SSE at work and a 20 period bar’s back with 2 as the multiplier on a 4 hour $QQQ.
The top one is the SSE, the bottom is 20. I turned off showing the SMA, and alerts for better visibility. We see the SSE version does not cross above 0 again until the trend totally reverses. I would much rather overestimate risk than underestimate it.
The BULL and BEAR plotted on the chart is a result of the following conditions. A BULL if the price is above our auto optimized SMA and the oscillator crosses over 0. BEAR is the opposite, price below the SMA and an oscillator cross below 0. Here is the Daily $NYSE:PLTR chart to show some.
Users have the options to toggle on and off the BULL and BEAR plots, SMA, as well as input their own lookback and multipliers.
We encourage traders to not follow indicators blindly, none are 100% accurate. SSE does not guarantee that the values generated will be the best for a given moment in time. Please comment on any desired updates, all criticism is welcome!
סקריפט קוד פתוח
ברוח האמיתית של TradingView, יוצר הסקריפט הזה הפך אותו לקוד פתוח, כך שסוחרים יוכלו לעיין בו ולאמת את פעולתו. כל הכבוד למחבר! אמנם ניתן להשתמש בו בחינם, אך זכור כי פרסום חוזר של הקוד כפוף ל־כללי הבית שלנו.
כתב ויתור
המידע והפרסומים אינם מיועדים להיות, ואינם מהווים, ייעוץ או המלצה פיננסית, השקעתית, מסחרית או מכל סוג אחר המסופקת או מאושרת על ידי TradingView. קרא עוד ב־תנאי השימוש.