OPEN-SOURCE SCRIPT
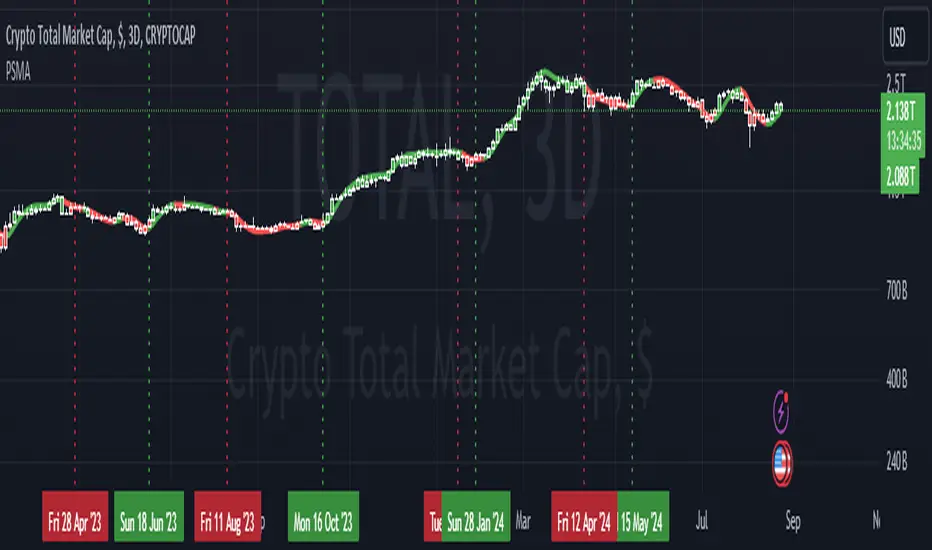
Price strength around MA

This indicatorit takes the HMA and calculates the difference between close and HMA. Within a lookback period it adds all values together where price is above/below the HMA. However, it squares the values before adding them together, so that larger differences have a bigger impact (this is to detect breakouts). After that it subtracts all the negative values from the positive ones so that in the end we have one single number that represents price behavior in the lookback period. This number is then added to the difference between an EMA and a SMA to produce the final signal of this indicator.
סקריפט קוד פתוח
ברוח האמיתית של TradingView, יוצר הסקריפט הזה הפך אותו לקוד פתוח, כך שסוחרים יוכלו לעיין בו ולאמת את פעולתו. כל הכבוד למחבר! אמנם ניתן להשתמש בו בחינם, אך זכור כי פרסום חוזר של הקוד כפוף ל־כללי הבית שלנו.
כתב ויתור
המידע והפרסומים אינם מיועדים להיות, ואינם מהווים, ייעוץ או המלצה פיננסית, השקעתית, מסחרית או מכל סוג אחר המסופקת או מאושרת על ידי TradingView. קרא עוד ב־תנאי השימוש.