OPEN-SOURCE SCRIPT
test - Classification

Tensor-Based Classification Experiment
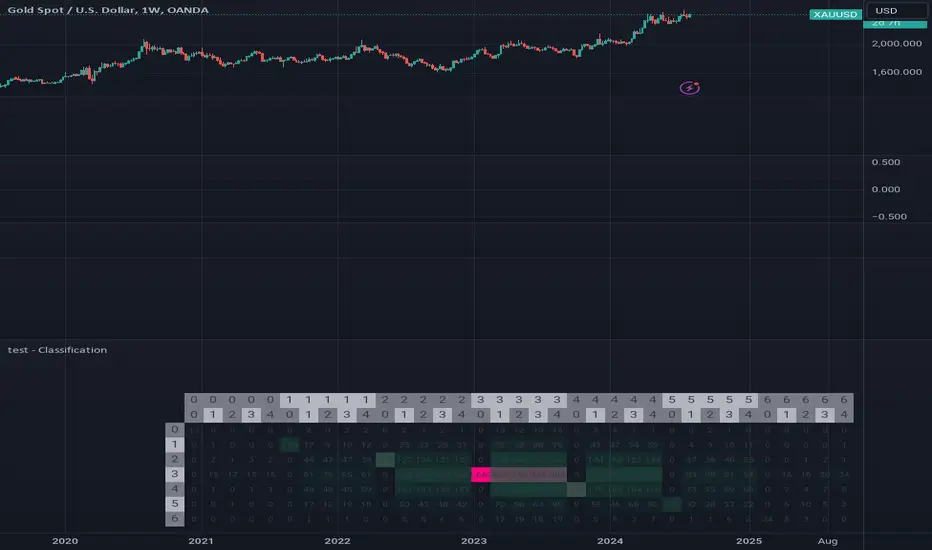
This innovative script represents an experimental foray into classification techniques, specifically designed to analyze returns within a compact time frame. By leveraging tensor-based analytics, it generates a comprehensive table that visually illustrates the distribution of counts across both current and historical bars, providing valuable insights into market patterns.
The script's primary objective is to classify returns over a small window, using this information to inform trading decisions. The output table showcases a normal distribution of count values for each bar in the lookback period, allowing traders to gain a deeper understanding of market behavior and identify potential opportunities.
Key Features:
- Experimental classification approach utilizing tensor-based analytics
- Compact time frame analysis (small window)
- Comprehensive table displaying return counts across current and historical bars
- Normal distribution visualization for better insight into market patterns
- By exploring this script, traders can gain a deeper understanding of the underlying dynamics driving market movements and develop more effective trading strategies.
סקריפט קוד פתוח
ברוח האמיתית של TradingView, יוצר הסקריפט הזה הפך אותו לקוד פתוח, כך שסוחרים יוכלו לעיין בו ולאמת את פעולתו. כל הכבוד למחבר! אמנם ניתן להשתמש בו בחינם, אך זכור כי פרסום חוזר של הקוד כפוף ל־כללי הבית שלנו.
כתב ויתור
המידע והפרסומים אינם מיועדים להיות, ואינם מהווים, ייעוץ או המלצה פיננסית, השקעתית, מסחרית או מכל סוג אחר המסופקת או מאושרת על ידי TradingView. קרא עוד ב־תנאי השימוש.