OPEN-SOURCE SCRIPT
מעודכן KST-Based MACD

As a follow-up to my previous script:

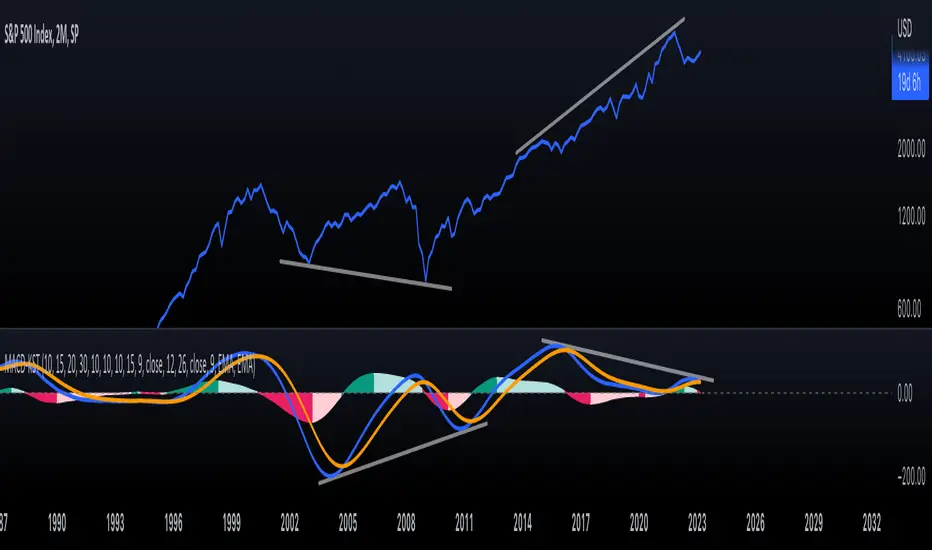
I am posting a stand-alone KST-based MACD.
Note that this indicator is highly laggy. Specific care must be taken when using it.
The MACD-Signal crossing is quite delayed but it is a definite confirmation.
For earlier signs, the Histogram must be analyzed. A shift from Green-White signals the 1st Bear Signal.
A MACD-Signal crossing signals the 2nd Bear SIgnal.
The same applies for bull-signs.
This indicator is useful for long-term charts on which one might want to pinpoint clear, longterm divergences.
Standard RSI, Stochastic RSI and MACD are notoriously problematic when trying to pinpoint long-term divergences.
Finally, this indicator is not meant for pinpointing entry-exit positions. I find it useful for macro analysis. In my experience, the decreased sensitivity of this indicator can show very strong signs, that can be quite laggy.
Inside the indicator there is a setting for "exotic calculations". This is an attempt to make this chart work in both linear/negative charts (T10Y2Y) and log charts (SPX)
Tread lightly, for this is hallowed ground.
-Father Grigori
הערות שחרור
Minor code change.הערות שחרור
Added a ribbon, I love that stuff...הערות שחרור
Aesthetic changes.הערות שחרור
Updates in default values to make the indicator more responsive, while keeping it beautiful.הערות שחרור
Added copyright. I love that indicator.הערות שחרור
Now KST is calculated using EMA by default. This is done for increased sensitivity. You can always revert back to SMA.סקריפט קוד פתוח
ברוח האמיתית של TradingView, יוצר הסקריפט הזה הפך אותו לקוד פתוח, כך שסוחרים יוכלו לעיין בו ולאמת את פעולתו. כל הכבוד למחבר! אמנם ניתן להשתמש בו בחינם, אך זכור כי פרסום חוזר של הקוד כפוף ל־כללי הבית שלנו.
כתב ויתור
המידע והפרסומים אינם מיועדים להיות, ואינם מהווים, ייעוץ או המלצה פיננסית, השקעתית, מסחרית או מכל סוג אחר המסופקת או מאושרת על ידי TradingView. קרא עוד ב־תנאי השימוש.
סקריפט קוד פתוח
ברוח האמיתית של TradingView, יוצר הסקריפט הזה הפך אותו לקוד פתוח, כך שסוחרים יוכלו לעיין בו ולאמת את פעולתו. כל הכבוד למחבר! אמנם ניתן להשתמש בו בחינם, אך זכור כי פרסום חוזר של הקוד כפוף ל־כללי הבית שלנו.
כתב ויתור
המידע והפרסומים אינם מיועדים להיות, ואינם מהווים, ייעוץ או המלצה פיננסית, השקעתית, מסחרית או מכל סוג אחר המסופקת או מאושרת על ידי TradingView. קרא עוד ב־תנאי השימוש.