OPEN-SOURCE SCRIPT
Current RSI vs Sector RSI Comparison

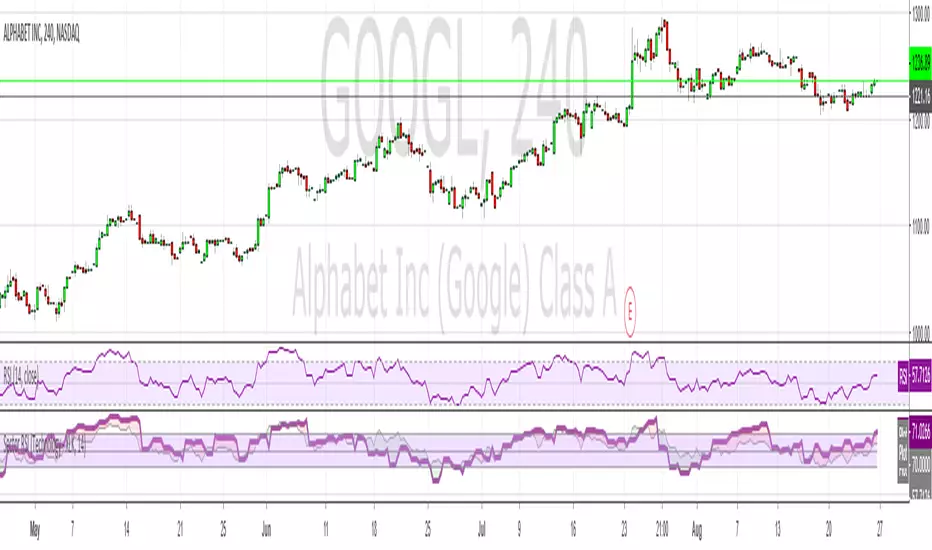
In the example above GOOGL's RSI is being compared against the RSI for XLK, the technology sector fund. The red and green areas make it easy to see if Google is under or overperforming relative to other tech stocks. I've included a normal RSI above it for comparison.
You can compare any stock to a sector, i.e. JP Morgan (JPM) versus the financial sector (XLF), or whatever your heart desires. All major sectors are selectable from a drop-down box and the output can also be visualised as a histogram too, much like a MACD.
You can compare any stock to a sector, i.e. JP Morgan (JPM) versus the financial sector (XLF), or whatever your heart desires. All major sectors are selectable from a drop-down box and the output can also be visualised as a histogram too, much like a MACD.
סקריפט קוד פתוח
ברוח האמיתית של TradingView, יוצר הסקריפט הזה הפך אותו לקוד פתוח, כך שסוחרים יוכלו לעיין בו ולאמת את פעולתו. כל הכבוד למחבר! אמנם ניתן להשתמש בו בחינם, אך זכור כי פרסום חוזר של הקוד כפוף ל־כללי הבית שלנו.
כתב ויתור
המידע והפרסומים אינם מיועדים להיות, ואינם מהווים, ייעוץ או המלצה פיננסית, השקעתית, מסחרית או מכל סוג אחר המסופקת או מאושרת על ידי TradingView. קרא עוד ב־תנאי השימוש.