OPEN-SOURCE SCRIPT
Periodic price change comparison
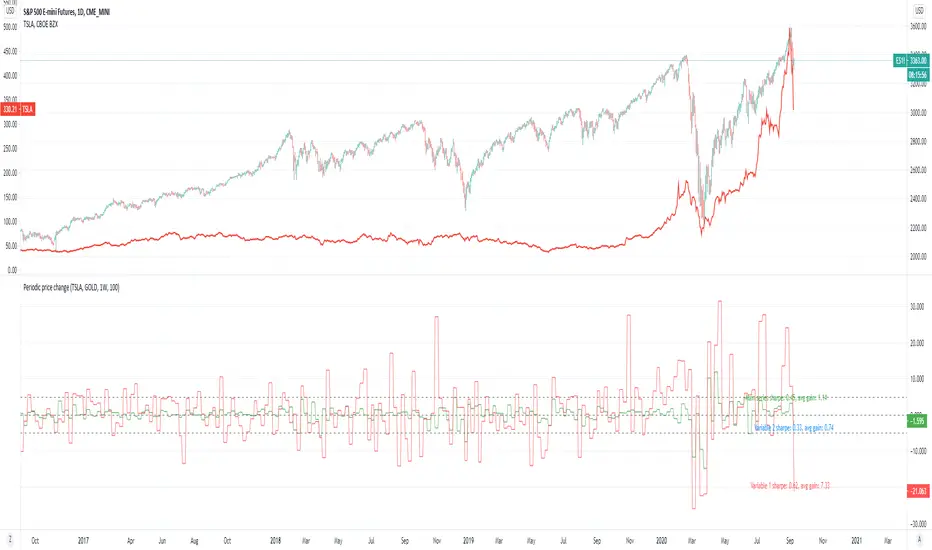
Periodic price change.
Application:
Sector rotation analysis by comparing different tickers.
Simple statistical analysis (with lookback period) for knowing how good they were.
If you are a believer in sector rotation, you can add different sector stocks to see which of them are lagged behind and buy them.
In this example, you could see tesla periodically fall behind the market. You can buy it when it is on that zone.
And you can also refer to the sharpe ratio and the average gain rate on the chart to see how good the stocks were.
סקריפט קוד פתוח
ברוח האמיתית של TradingView, יוצר הסקריפט הזה הפך אותו לקוד פתוח, כך שסוחרים יוכלו לעיין בו ולאמת את פעולתו. כל הכבוד למחבר! אמנם ניתן להשתמש בו בחינם, אך זכור כי פרסום חוזר של הקוד כפוף ל־כללי הבית שלנו.
כתב ויתור
המידע והפרסומים אינם מיועדים להיות, ואינם מהווים, ייעוץ או המלצה פיננסית, השקעתית, מסחרית או מכל סוג אחר המסופקת או מאושרת על ידי TradingView. קרא עוד ב־תנאי השימוש.