Elliott Wave - Stocks
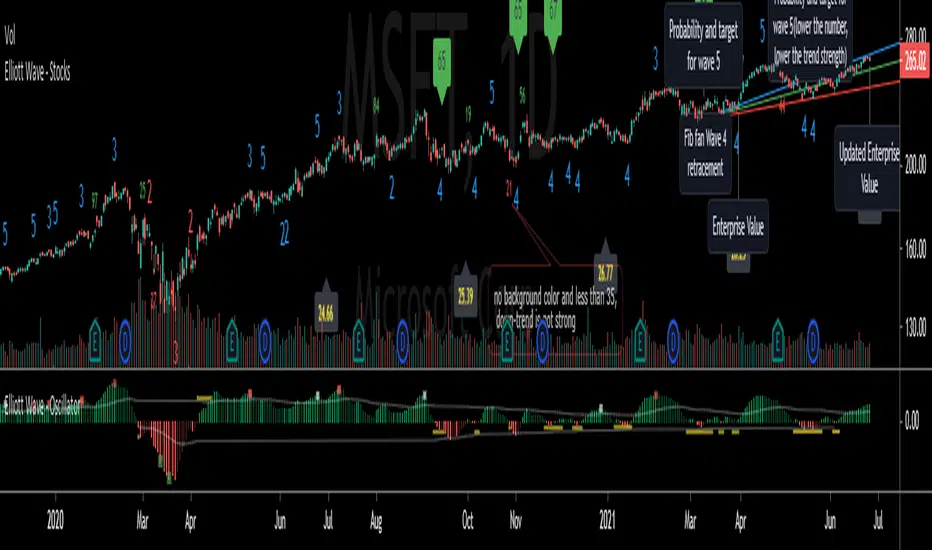
Based on my Elliott Wave - Oscillator, this signals are converted into numbers displayed on chart:
Waves2, Waves3, Waves4, Waves5:
- Indicated on Chart with numbers
Fib fan Wave 4 retracement
- Blue, green and red lines for optimum retracement
Probability and target for wave 5
- Plotted when wave 4 is found
- Stays visible in chart
- Target is based on Monthly Fibonnacci
- Probability: If current trend volume is bigger than previous opposite wave trend volume, probability is painted with color of trend background(for a trend to continue, value is recommended bigger than 35)
Projection Wave 4 (if wave 3 detected) and Projection Wave 5(if wave 4 detected)
- Only displayed when waves are active, else not displayed and not saved on chart
- For upside trend 2 blue target lines are displayed based on Monthly Fibonnacci
- For downside trend 2 red target lines are displayed based on Monthly Fibonnacci
Fundamentals: Enterprise Value
- Displayed when financial reports are updated to database
- Also displayed the latest calculated enterprise value with current stock price and last financial report
REMINDER OF OSCILATOR USE:
Waves3: Indicated in RED Line(Upwards) and Green Line(Downwards)
- Detects wave greater than SMA
Waves4: Maximum height indicated in yellow Line
- Detects when wave greater than SMA (Wave 3 or 5) approaches wave 4 regression point
Waves5: Indicated in White Line
- Detects divergence in oscilator and price, meaning end of trend
Appreciate any suggestions, collaboration, comments or ideas.
- Detects Waves 2, 3 , 4 and 5
*Fib fan Wave 4 retracement
*Probability and target for wave 5
*Projection Wave 4 (if wave 3 detected)
*Projection Wave 5(if wave 4 detected)
*Alerts for Waves 2, 3, 4 and 5
*Fundamentals: Enterprise Value
*Better and accurate targets for waves based on Stocks
- Much less graph noise overall
Fundamentals: Enterprise Value
- Calculated based on actual and historical financial data
- Gives a projection at where stock should be
- If stock is in its range, triangles are diplayed
- If stock is not in range, displays the projection
סקריפט להזמנה בלבד
רק משתמשים שאושרו על ידי המחבר יכולים לגשת לסקריפט הזה. יהיה עליך לשלוח בקשת גישה ולקבל אישור לשימוש. בדרך כלל, הגישה ניתנת לאחר תשלום. למידע נוסף, עקוב אחר ההוראות של היוצר בהמשך או צור קשר עם edgartrader1396 ישירות.
TradingView לא ממליצה לשלם עבור סקריפט או להשתמש בו אלא אם כן אתה סומך לחלוטין על המחבר שלו ומבין כיצד הוא פועל. ייתכן שתוכל גם למצוא חלופות חינמיות וקוד פתוח ב-סקריפטים הקהילתיים שלנו.
הוראות המחבר
כתב ויתור
סקריפט להזמנה בלבד
רק משתמשים שאושרו על ידי המחבר יכולים לגשת לסקריפט הזה. יהיה עליך לשלוח בקשת גישה ולקבל אישור לשימוש. בדרך כלל, הגישה ניתנת לאחר תשלום. למידע נוסף, עקוב אחר ההוראות של היוצר בהמשך או צור קשר עם edgartrader1396 ישירות.
TradingView לא ממליצה לשלם עבור סקריפט או להשתמש בו אלא אם כן אתה סומך לחלוטין על המחבר שלו ומבין כיצד הוא פועל. ייתכן שתוכל גם למצוא חלופות חינמיות וקוד פתוח ב-סקריפטים הקהילתיים שלנו.