OPEN-SOURCE SCRIPT
UCSgears_Linear Regression Slope

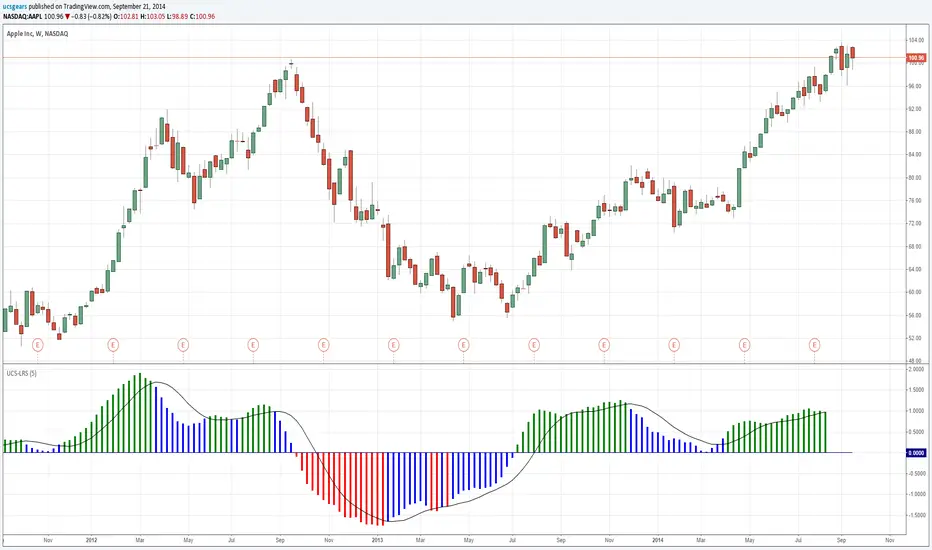
This is version 1 of the Linear Regression Slope. In ideal world the Linear regression slope values will remain same for any time period length. because the equation is y = mx+b, where m is the slope. All I did here is m = y/x
The Main Purpose of this indicator is to see, if the Trend is accelerating or decelerating.
The first Blue bar will caution when a strong trend is losing strength. I will leave the rest for you to explore.
I picked AAPL again, because it does have both up and down trend, in the recent time.
Mistake in the code
Corrected Version - tradingview.com/v/ec2jvh2Z/
סקריפט קוד פתוח
ברוח האמיתית של TradingView, יוצר הסקריפט הזה הפך אותו לקוד פתוח, כך שסוחרים יוכלו לעיין בו ולאמת את פעולתו. כל הכבוד למחבר! אמנם ניתן להשתמש בו בחינם, אך זכור כי פרסום חוזר של הקוד כפוף ל־כללי הבית שלנו.
Uday C Santhakumar
udaycs.substack.com/
udaycs.substack.com/
כתב ויתור
המידע והפרסומים אינם מיועדים להיות, ואינם מהווים, ייעוץ או המלצה פיננסית, השקעתית, מסחרית או מכל סוג אחר המסופקת או מאושרת על ידי TradingView. קרא עוד ב־תנאי השימוש.