OPEN-SOURCE SCRIPT
US Fed Rate Cut Historical Dates
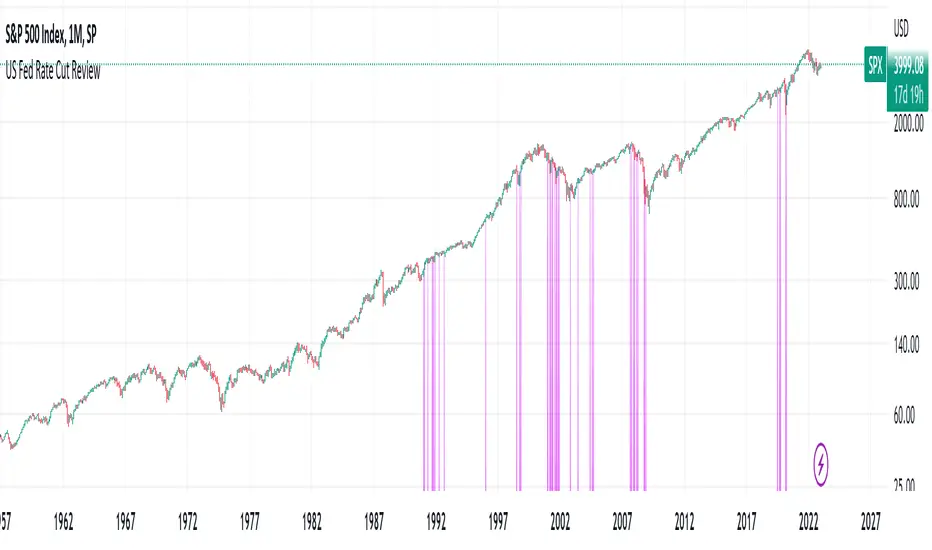
The script applies Purple (color can be changed) highlights to the days that the US Federal Reserve Cut interest rates. Data goes back to the 60's. This can be applied to any chart/timeframe to view how the asset behaved before/during/after Federal Rate cuts.
****This was updated as of Dec 2022... Any decisions after Dec 2022 will not show up in this indicator.
Versions may be updated periodically to include new data.
Hope this helps. Happy Trades
-SnarkyPuppy
****This was updated as of Dec 2022... Any decisions after Dec 2022 will not show up in this indicator.
Versions may be updated periodically to include new data.
Hope this helps. Happy Trades
-SnarkyPuppy
סקריפט קוד פתוח
ברוח האמיתית של TradingView, יוצר הסקריפט הזה הפך אותו לקוד פתוח, כך שסוחרים יוכלו לעיין בו ולאמת את פעולתו. כל הכבוד למחבר! אמנם ניתן להשתמש בו בחינם, אך זכור כי פרסום חוזר של הקוד כפוף ל־כללי הבית שלנו.
כתב ויתור
המידע והפרסומים אינם מיועדים להיות, ואינם מהווים, ייעוץ או המלצה פיננסית, השקעתית, מסחרית או מכל סוג אחר המסופקת או מאושרת על ידי TradingView. קרא עוד ב־תנאי השימוש.