OPEN-SOURCE SCRIPT
Pi Frame (Dynamic)

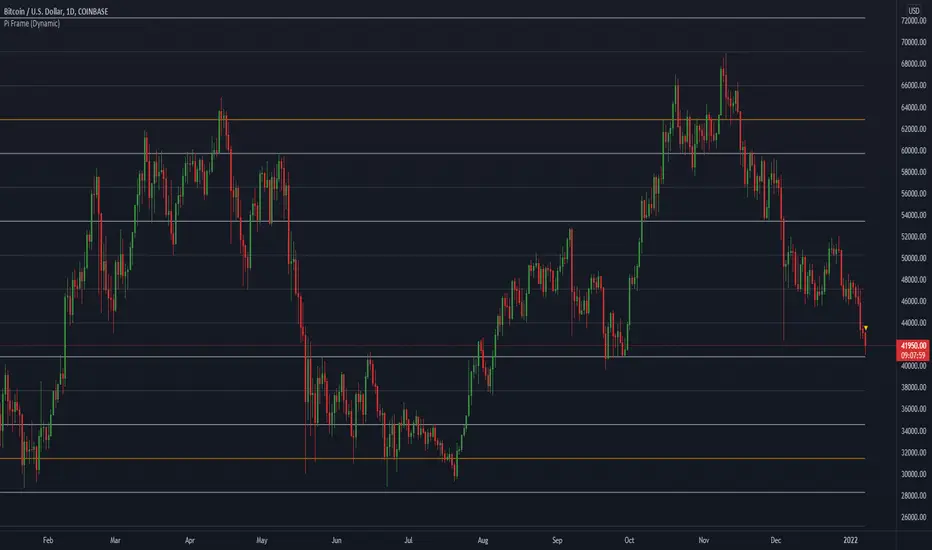
Pi frame posted as lines instead of plots, allowing for complete colour change and extension.
Be warned, the entire frame moves in real time with price so do not look at the corresponding lines for scale factors below (i.e. it will show the current levels in this graph for also under 10k).
To see the correct levels for the <10k range you can use the TV replay function or refer to my "Pi Price Levels" script, which plots accordingly with scale factor.
סקריפט קוד פתוח
ברוח האמיתית של TradingView, יוצר הסקריפט הזה הפך אותו לקוד פתוח, כך שסוחרים יוכלו לעיין בו ולאמת את פעולתו. כל הכבוד למחבר! אמנם ניתן להשתמש בו בחינם, אך זכור כי פרסום חוזר של הקוד כפוף ל־כללי הבית שלנו.
כתב ויתור
המידע והפרסומים אינם מיועדים להיות, ואינם מהווים, ייעוץ או המלצה פיננסית, השקעתית, מסחרית או מכל סוג אחר המסופקת או מאושרת על ידי TradingView. קרא עוד ב־תנאי השימוש.