OPEN-SOURCE SCRIPT
Bitcoin Fibonacci Log Regression
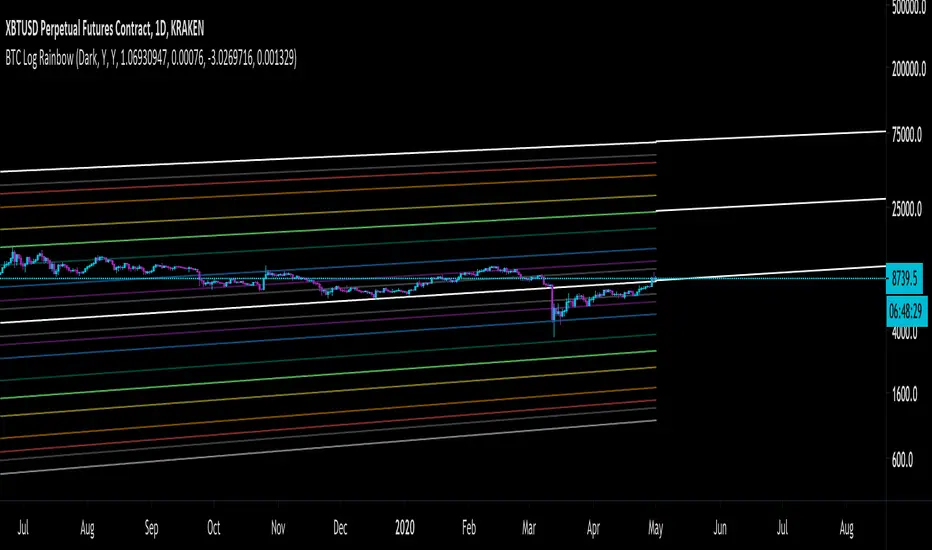
The "Zero Line" is the calculated logarithmic regression of Bitcoin over the last decade.
The rainbow above the Zero Line are the Fibonacci multiples from 0 --> 1 of the log regression (0.236, 0.382, etc.)
The rainbow below the Zero Line is identical, except that the multiples are negative (-0.236, -0.382, etc.)
For the first time ever, Bitcoin broke through the Zero Line (the natural regression) when it dumped on March 12-13. It looked at though the regression was invalidated when, in fact, it simply made an unprecedented move to a lower Fibonacci multiple.
Enjoy.
סקריפט קוד פתוח
ברוח האמיתית של TradingView, יוצר הסקריפט הזה הפך אותו לקוד פתוח, כך שסוחרים יוכלו לעיין בו ולאמת את פעולתו. כל הכבוד למחבר! אמנם ניתן להשתמש בו בחינם, אך זכור כי פרסום חוזר של הקוד כפוף ל־כללי הבית שלנו.
כתב ויתור
המידע והפרסומים אינם מיועדים להיות, ואינם מהווים, ייעוץ או המלצה פיננסית, השקעתית, מסחרית או מכל סוג אחר המסופקת או מאושרת על ידי TradingView. קרא עוד ב־תנאי השימוש.